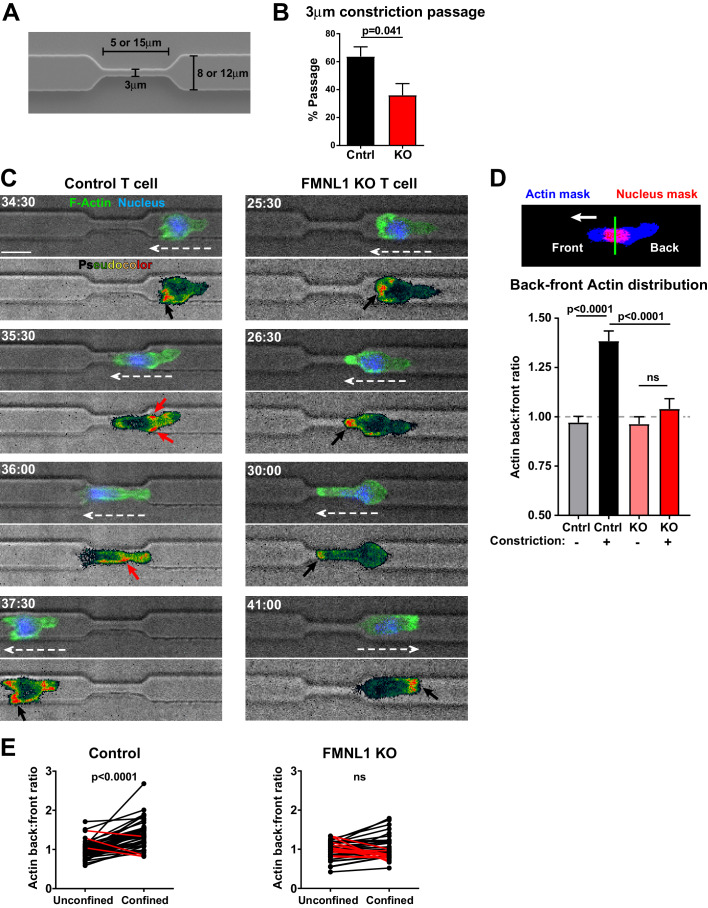
Figure 7. FMNL1 mediates posterior perinuclear actin polymerization to promote T cell migration through environmental constrictions.
Ex vivo activated control LifeAct-GFP and FMNL1 KO LifeAct-GFP T cells were stained with Hoechst, added to PDMS microchannels and imaged by spinning-disk confocal time-lapse microscopy. (A) Schematic of the PDMS microchannels with constrictions used in the experiments. (B) FMNL1 deficiency impairs the ability of T cells to migrate through 3 µm constrictions. Quantification of the percentage of T cell passage through 3 µm constrictions within microchannel devices. (C) Example images of WT LifeAct-GFP (Left panels and Video 3) and FMNL1 KO/LifeAct-GFP (Right panels and Video 4) T cells engaging microchannel constrictions. Top images, LifeAct-GFP (green) and Hoechst (DNA, blue) overlaid on the brightfield channel (gray). Bottom images, pseudocolor rendition of the LifeAct-GFP channel. White dashed arrows indicate cell direction, red arrows point to areas of F-actin accumulation at the back of the cell, black arrows indicate F-actin accumulation at the front of the cell. Time is min:sec, white scale bar = 10 µm. (D) FMNL1 promotes actin polymerization at the back of the nucleus during migration under confinement. Top, example of the image masking process to quantify F-actin distribution relative to the front and back of the nucleus. Bottom, quantification of the back-to-front ratio of F-actin distribution during unconfined and confined migration. (E) Paired analysis of individual T cells undergoing unconfined and confined migration. Data for cells that increase their F-actin back-to-front ratio under confinement are shown in black, data for cells that decrease the back-to-front ratio are in red. Data in B are the mean ± SEM from 3 independent experiments with a total of 83 control and 68 KO cells analyzed. Data in D are the mean ± SEM and data in E are pooled from 3 independent experiments with a total of 47 control and 35 KO cells analyzed. Statistics in B and E calculated using a two-tailed paired t-test; statistics in D calculated using One-way ANOVA with Sidak’s multiple comparisons. n.s. = not significant.

