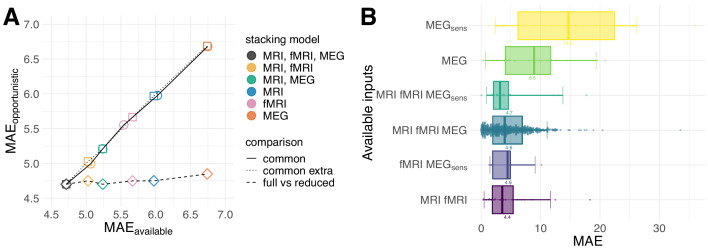
Figure 5. Opportunistic learning performance.
(A) Comparisons between opportunistically trained model and models restricted to common available cases. Opportunistic versus restricted model with different combinations scored on all 536 common cases (circles). Same analysis extended to include extra common cases available for sub-models (squares). Fully opportunistic stacking model (all cases, all modalities) versus reduced non-opportunistic sub-models (fewer modalities) on the cases available to the given sub-model (diamonds). One can see that multimodal stacking is generally of advantage whenever multiple modalities are available and does not impact performance compared to restricted analysis on modality-complete data. (B) Performance for opportunistically trained model for subgroups defined by different combinations of available input modalities, ordered by average error. Points depict single-case prediction errors. Boxplot-whiskers show the 5% and 95% uncertainty intervals. When performance was degraded, important modalities were absent or the number of cases was small, for example, in MEGsens where only sensor space features were present.

