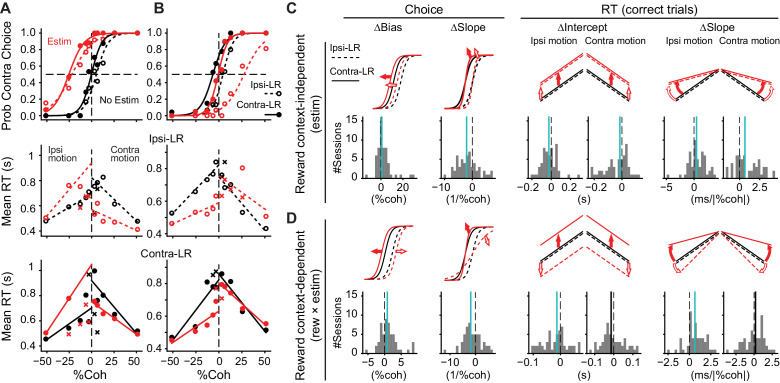
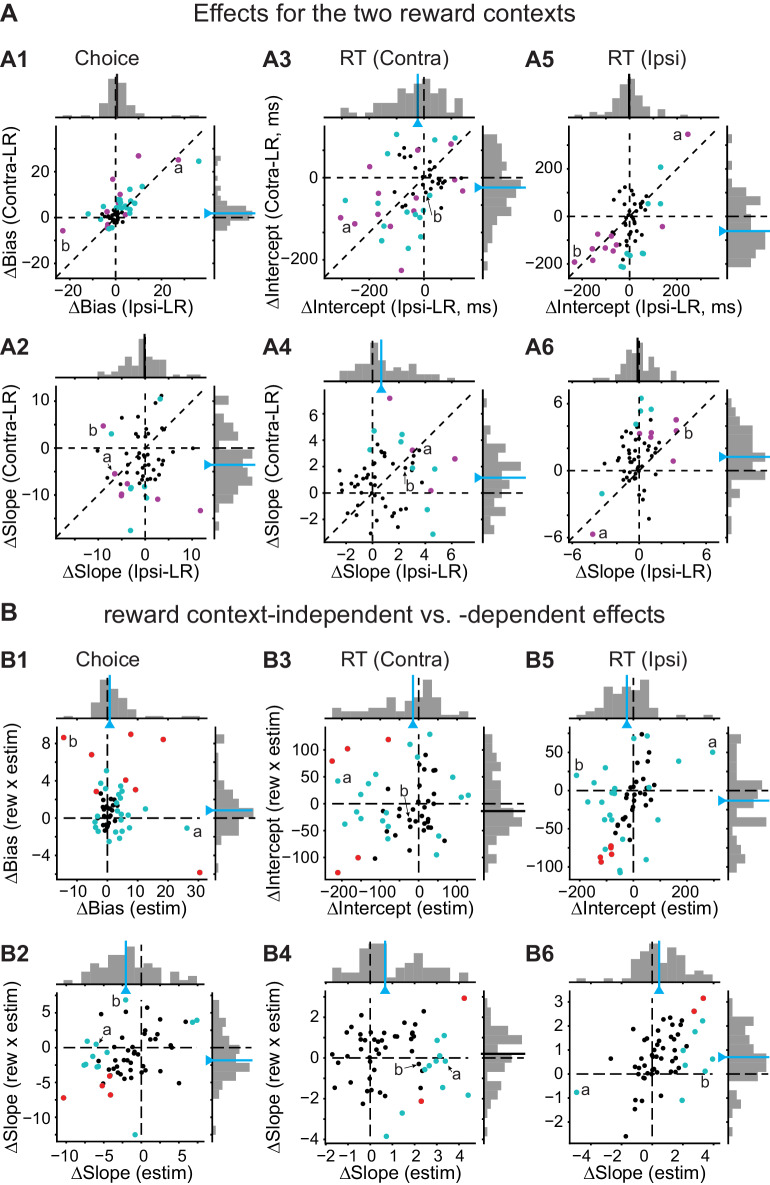
Figure 3. Caudate microstimulation affected the monkeys’ decision behavior.
(A, B) Two example sessions from monkey C showing different patterns of microstimulation effects. Black: trials without microstimulation; red: trials with microstimulation. Open circles and dashed lines: data and fits for blocks in which the ipsilateral choice was paired with large reward and the contralateral choice was paired with small reward. Filled circles and solid lines: data and fits for blocks in which the ipsilateral choice was paired with small reward and the contralateral choice was paired with large reward. Abscissa: signed coherence (positive: motion was toward the contralateral target; negative: motion was toward the ipsilateral target). Top panels: probability of making the contralateral choice. Lines are logistic fits to the choice data. Middle and bottom panels: mean reaction time (RT) for the two reward contexts. Circles and crosses represent correct and error choices, respectively. Lines: linear fits to single-trial RT data. (C, D) Summary of effects induced by microstimulation for both reward contexts (C, estim terms) and by interactions between microstimulation and reward context (D, rew × estim terms). The top rows illustrate the effects on psychometric and chronometric curves for positive values of the corresponding terms. Bottom rows show the histograms of changes in choice bias (logistic shift in %coh), perceptual sensitivity (logistic slope in 1/%coh), and intercept and slope of linear regression of RT as a function of unsigned motion coherence. Thick vertical lines indicate the median values. Green lines, Wilcoxon signed-rank test, p<0.05.


