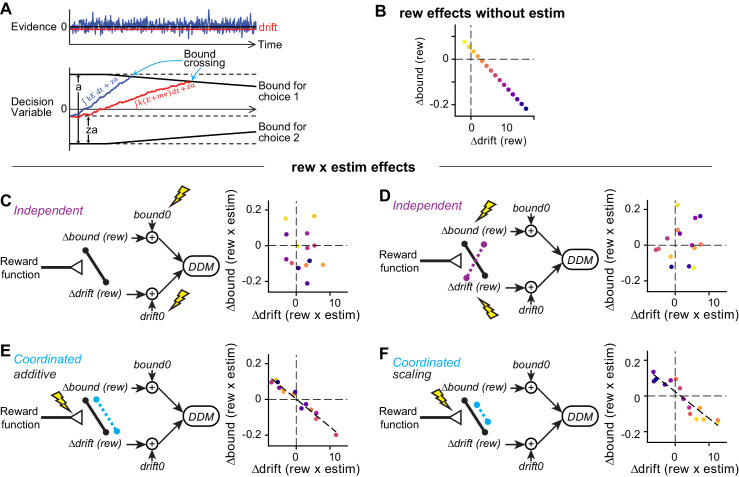
Figure 4. Illustration of correlation patterns induced by different hypothesized actions of microstimulation.
(A) Drift-diffusion model. Motion evidence (E) is modeled as samples from a Gaussian distribution (mean = signed coherence, variance = 1). The decision variable is computed as the time integral of E and compared at each time point to two (possibly time-varying) decision bounds. Crossing of either bound results in the corresponding choice. RT is modeled as the sum of the time to bound crossing and a non-decision time. Bias can be induced with offsets in evidence (me, biasing the drift rate) or relative bound heights (z, biasing bounds). (B) For the simulations in (C-F), reward context-dependent modulation of drift and bound on trials without microstimulation (i.e. Δdrift (rew) and Δbound (rew)) were negatively correlated across sessions. Each colored circle represents a session. (C and D) Microstimulation induces independent changes in baseline drift0 and bound0 values (C) or independent changes in Δdrift (rew) and Δbound (rew) (D). Note the absence of negative correlation in the rew × estim effects. (E) Microstimulation additively affected reward context-dependent adjustments in drift and bound in a coordinated manner. The dashed line represents a significant correlation. (F) Microstimulation additively and multiplicatively affected reward context-dependent adjustments in drift and bound in a coordinated manner. Note that the rew × estim effects were negatively correlated between drift and bound (dashed line). The rew × estim effects were negatively correlated with the reward effects without microstimulation in F (compare the orders of color progression to that in B), but not (C-E). See Materials and methods for simulation parameters.

