
Figure 5. Microstimulation induced correlated changes in the reward modulation of drift and bound.
(A) Scatter plots of changes in drift and bound induced by electrical microstimulation (abscissa and top histograms) and by interactions between electrical microstimulation and reward condition (ordinate and right histograms). Solid lines in histograms: mean values across sessions, t-test, p>0.05. Labels (a, b) correspond to the example sessions in Figure 3A and B, respectively. (B) On trials without microstimulation, the differences in Δdrift and Δbound between the two reward contexts were negatively correlated. Line and shaded area: linear regression and 95% confidence interval, t-test, p<0.0001. “a” and “b” indicate the data points for the examples in Figure 3A and B. Data are color-coded by the values of Δbound (rew) no estim. (C) Scatter plots of reward effects on trials without microstimulation (abscissa) and interaction effects (ordinate) for Δdrift (left) and Δbound (right). Lines represent results of linear regression (shaded area: 95% confidence interval). (D) The interaction effects (Δdrift (rew x estim) and Δbound (rew x estim)), equivalent to the difference between “Δdrift/bound (rew) with estim” and “Δdrift/bound (rew) no estim”, were negatively correlated. Same format as B. t-test, p<0.0001. Red dashed line re-plots the linear regression results from Figure 5B, using the appropriate range of Δdrift (rew x estim) as x-values. Data are color-coded by the values of Δbound (rew) no estim. Note that the roughly reversed orders of color progressions in B and D is most consistent with simulated effects in Figure 4F.

Figure 5—figure supplement 1. DDM fits to example sessions in Figure 3.

Figure 5—figure supplement 2. DDM fitting results.

Figure 5—figure supplement 3. Biases in drift and bounds together accounted for biases measured in logistic fits.
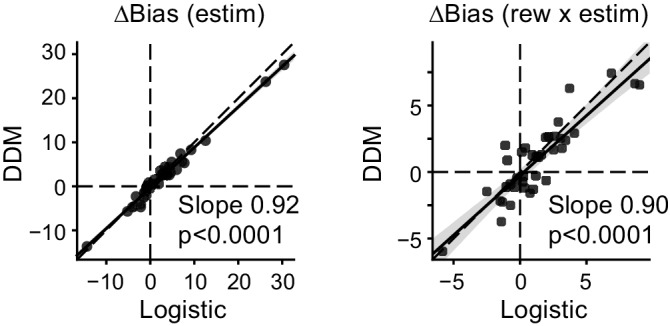
Figure 5—figure supplement 4. Both monkeys showed similar correlation patterns between ∆drift and ∆bound.
