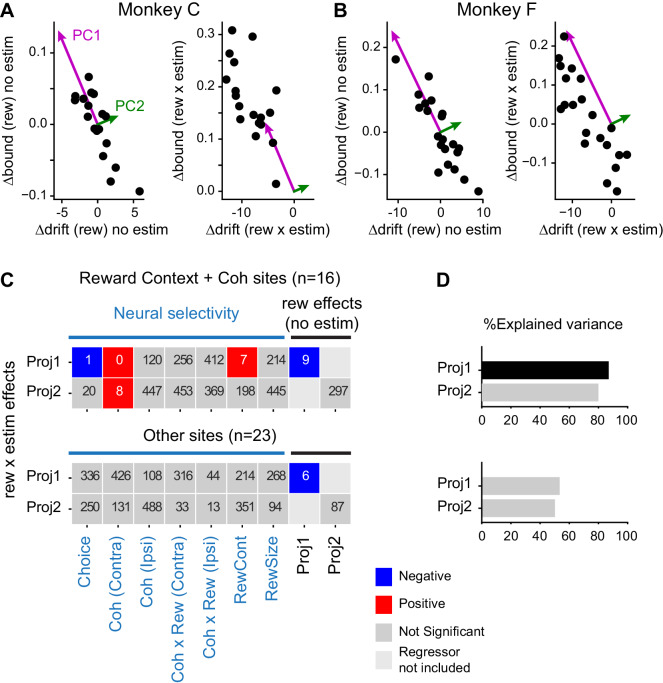
Figure 7. Microstimulation effects on coordination depended on neural selectivity and baseline adjustments of drift and bound.
(A and B) Principal components (PCs) were estimated for reward context modulation of Δdrift and Δbound without microstimulation (left panels; mean subtracted) for the two monkeys separately. The values of Δdrift (rew × estim) and Δbound (rew × estim) were projected onto these two PCs (right panels). (C) Visualization of the dependence of rew × estim effects on neural selectivity and reward effects without microstimulation for sites with combined modulations by motion coherence and reward context (top) and for other sites (bottom). Proj1(2): projection onto PC1(2). Each row shows the results from one multiple linear regression, with the quantity on the ordinate as the dependent variable and the quantities on the abscissa as the independent variables. Significance was assessed with bootstrap methods using 1000 shuffles of the independent variables. The number in each box indicates the number of shuffles with the same or stronger effect as the experimental data (e.g., six means an estimated p value of 0.006 and 0 means an estimated p value of < 0.001). Colors indicate the signs of regression coefficients (significance criterion: p<0.0125 = 0.05/4-regressions). (D) Percent explained variance for the regressions in (C), respectively. A black bar indicates that the experimental value is outside the 95 percentile of the bootstrapped distribution.


