. 2020 Jun 8;9:e56707. doi: 10.7554/eLife.56707

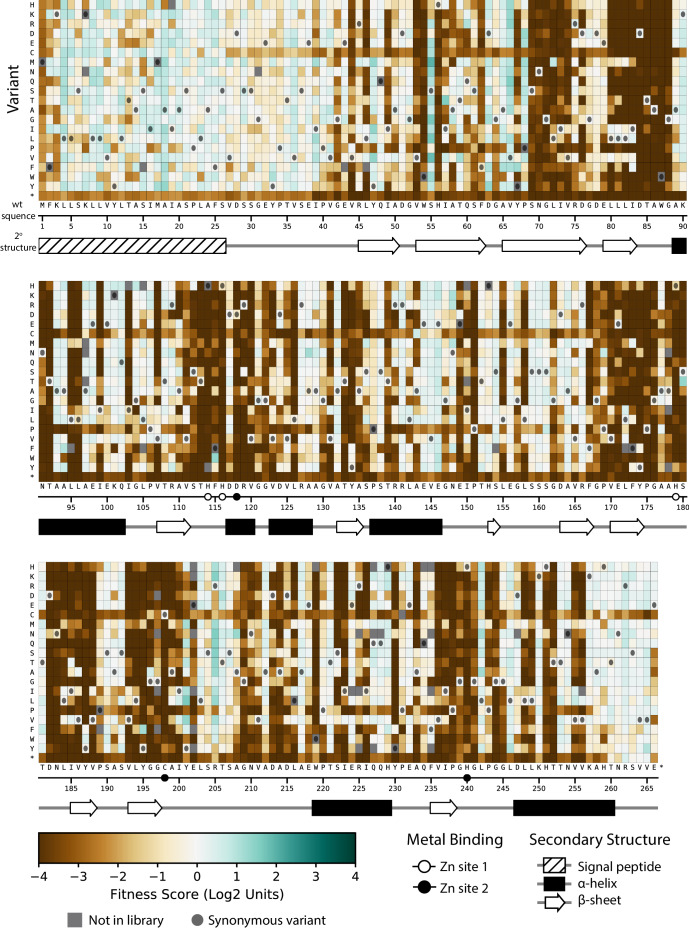
Figure 3. Fitness of all VIM-2 single amino acid variants under 128 µg/mL AMP selection.

Each cell in the heat map represents the fitness score of a single amino acid variant. Synonymous variants are indicated by dark grey circles and variants that are not present in the library are in grey. The x-axis under the heat map indicates the wt residue and position (the six active site metal binding residues are highlighted as circles), while the y-axis indicates the variant residue at that position. The secondary structure of the wtVIM-2 crystal structure (PDB: 4bz3) is displayed below the heat map. Corresponding heat maps for variants under selection with CTX and MEM can be found in Figure 3—figure supplement 1 and Figure 3—figure supplement 2, respectively. A comparison between the distributions of variants with each mutated amino acid can be found in Figure 3—figure supplement 3. All fitness data used in the heat maps can be found in Supplementary file 2A.

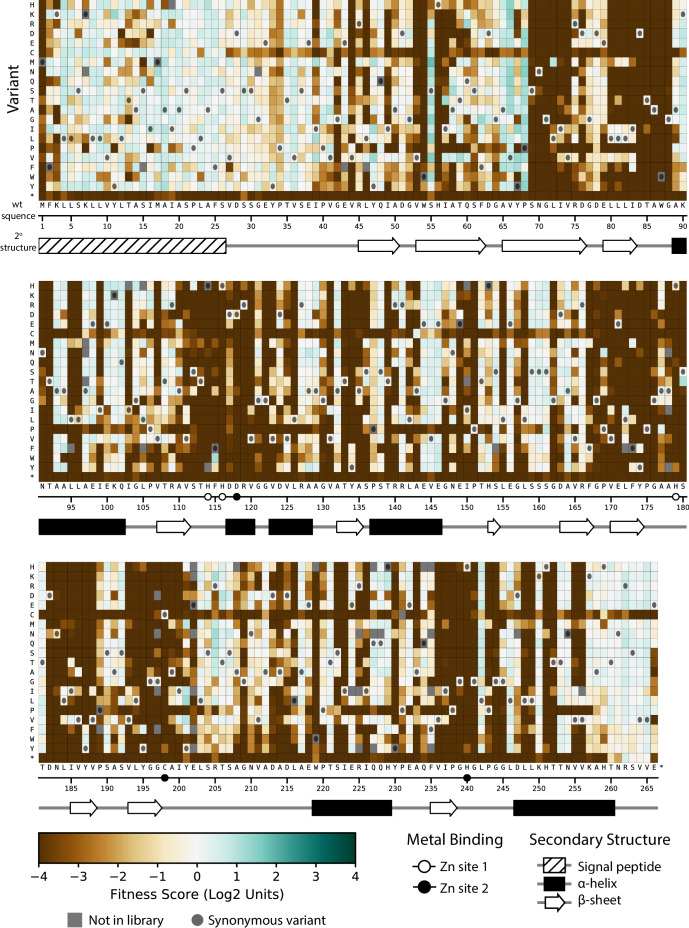
Figure 3.

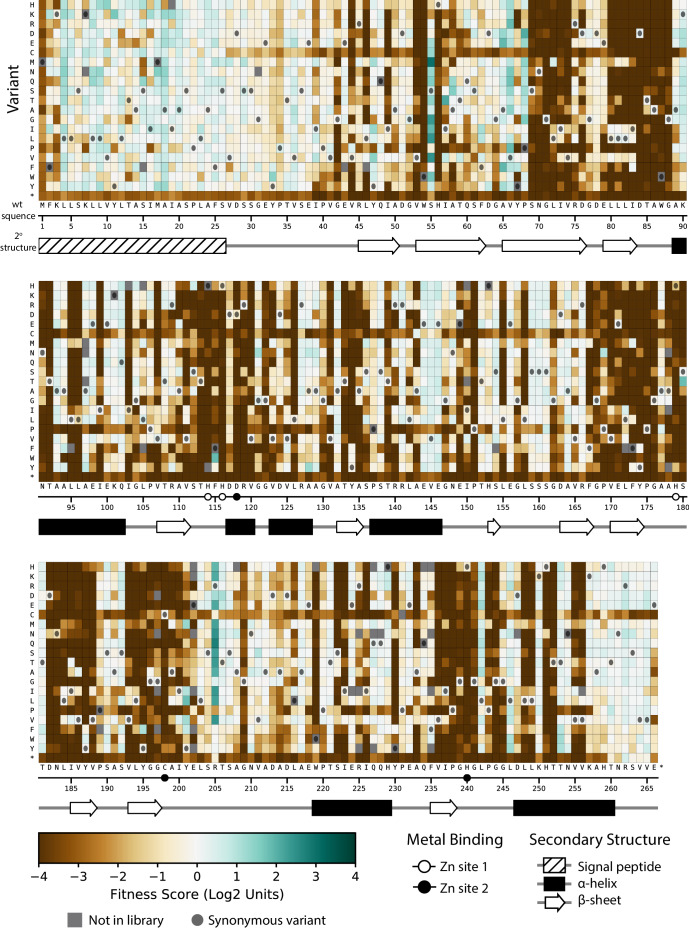
Figure 3—figure supplement 1. Fitness of all VIM-2 single amino acid variants under 4.0 µg/mL CTX selection.

Figure 3—figure supplement 1.

Each cell in the heat map represents the fitness score of a single amino acid variant. Synonymous variants are indicated as dark grey circles and variants that are not present in the library are in grey. The x-axis under the heat map indicates the wt residue and position (the six active site metal binding residues are highlighted as circles), while the y-axis indicates the variant residue at that position. The secondary structure of the wtVIM-2 crystal structure (PDB: 4bz3) is displayed below the heat map.
Figure 3—figure supplement 2. Fitness of all VIM-2 single amino acid variants under 0.031 µg/mL MEM selection.

Figure 3—figure supplement 2.

Each cell in the heat map represents the fitness score of a single amino acid variant. Synonymous variants are indicated as dark grey circles and variants that are not present in the library are in grey. The x-axis under the heat map indicates the wt residue and position (the six active site metal binding residues are highlighted as circles), while the y-axis indicates the variant residue at that position. The secondary structure of the wtVIM-2 crystal structure (PDB: 4bz3) is displayed below the heat map.
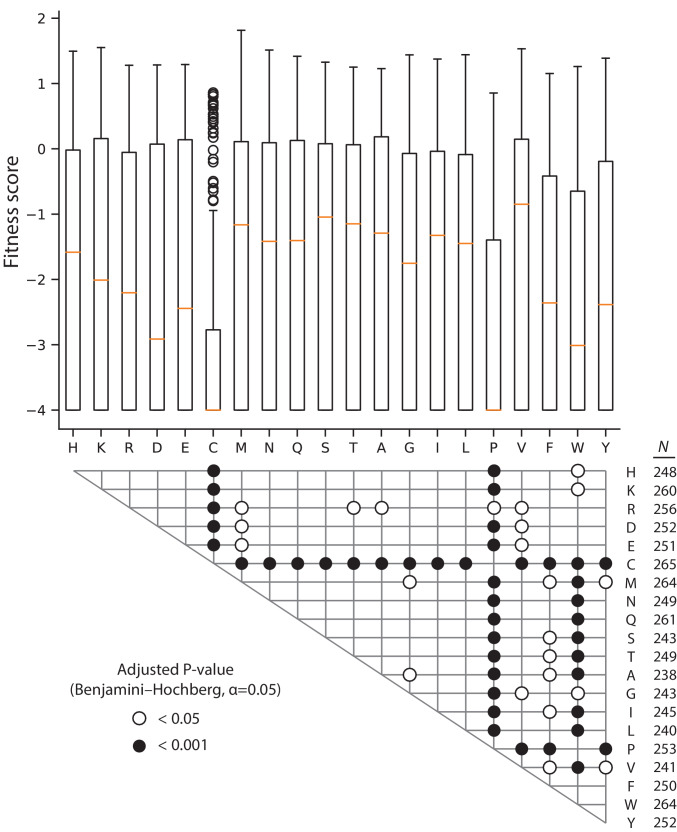
Figure 3—figure supplement 3. Comparison of fitness score by variant residue in 128 µg/mL AMP.

Figure 3—figure supplement 3.

The box and whisker plots depict the distribution of fitness scores for all missense variants mutated to the indicated amino acid, with the median highlighted by the orange line. The grid below the plot shows the significant results of two-tailed Mann-Whitney U tests between all pairwise combinations of amino acid fitness score distributions; the P-values are adjusted for false discovery rate using the Benjamini-Hochberg procedure with α = 0.05 (190 tests total). The number of variants in each amino acid distribution is shown to the right of the grid.