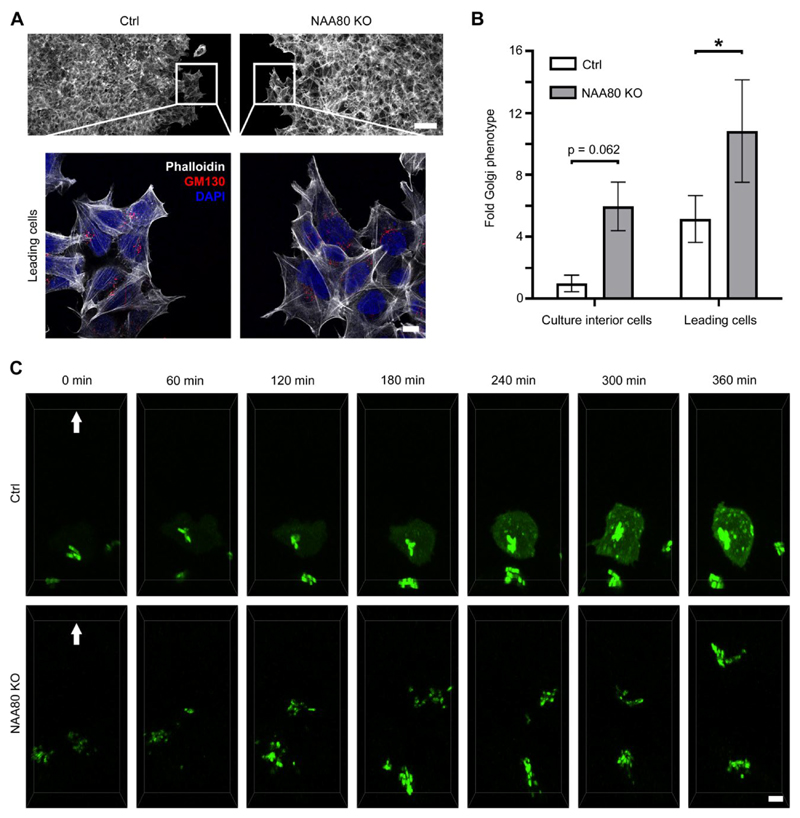
Fig. 3. Increased Golgi fragmentation in NAA80 KO cells is independent of cell motility and involves enhanced Golgi dynamics.
A. HAP1 Ctrl and NAA80 KO cells in a wound-healing assay, fixed 18 h post wounding, labelled with GM130 antibodies and stained with phalloidin. Confocal STED images show an overview of the wound edge (top, only phalloidin, 25x objective) and zoomed-in images showing the Golgi morphology in cells at the leading edge (100x objective). Representative images from three independent experiments are shown; scale bars correspond to 50 or 10 μm (overview or zoomed-in images, respectively). B. Quantification of Golgi fragmentation in the motile (leading edge) and relatively stationary (culture interior) cells from A. The mean ± sd from three independent experiments is shown, including n ≥ 200 cells per experiment. * p ≤ 0.05, one-way ANOVA with Tukey’s multiple comparison test. C. Selected images from live-cell recordings of HAP1 Ctrl or NAA80 KO cells transiently transfected with mannosidase II–mNeonGreen and migrating into the wound area during the total 6 h period of imaging. Cells were seeded 24 h and transfected 22 h prior to wound infliction and subsequent initiation of imaging. Shown are maximum projections of selected z-stacks (5 optical sections) acquired with spinning disk microscopy. Arrows point in the direction of cell movement. Representative cells at the very wound edge were chosen from a minimum of three independent experiments. Scale bar = 5 μm.

