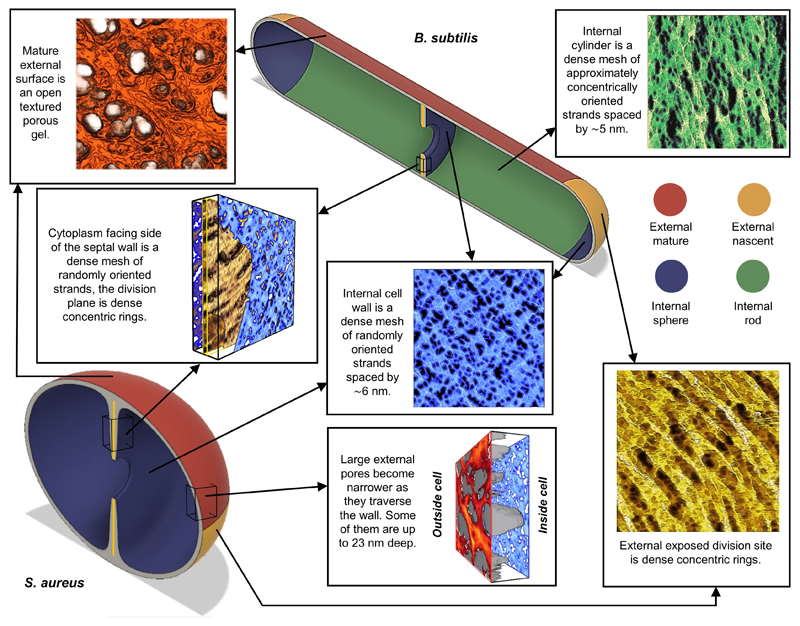
Extended Data Figure 10. Gram positive bacterial cell wall molecular architecture schematic.
Schematic diagram showing proposed peptidoglycan organisation derived from AFM imaging for both S. aureus and B. subtilis. Drawings top-centre and bottom-left indicate areas of distinct morphology within the cell wall during the division process. Insets show schematised representative AFM images of the different architectures within the cell wall, all displayed at the same scale.

