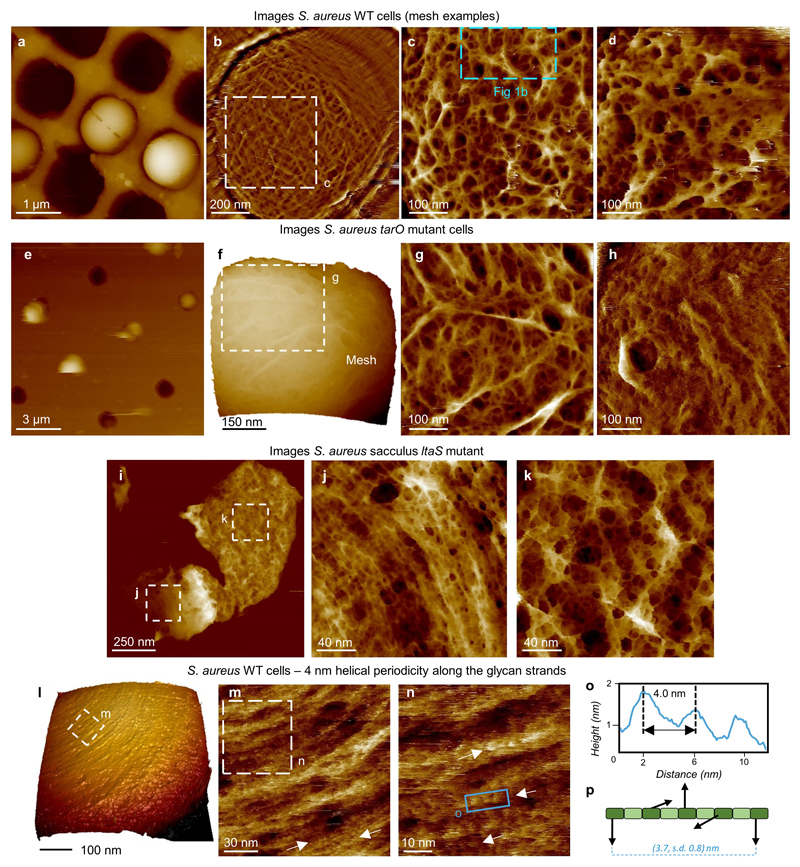
Extended Data Figure 1. S. aureus cells and sacculi: cell wall fine structure and other cell wall components.
a, Overview image of individual S. aureus wild type (WT) live cells trapped inside silicon holes. Topographic data scale (DS) = 1100 nm. b, Individual cell showing mature mesh covering the top surface, high pass filtered, filter size = 0.23 μm, vertical. c, Higher resolution image within b with blue dashed box denoting the location of Fig 1b in the main text. DS = 35 nm. d, Example of mesh from another cell. DS = 58 nm. e, S.aureus tarO mutant cells (this mutant lacks wall teichoic acids - WTAs) trapped in silicon holes (provided by NuNano – see Methods for sample preparation). DS = 2033 nm. f, Higher resolution image on an individual cell showing the mature mesh. DS = 580 nm, 3D details: Z aspect ratio = 1.0, Pitch = 16.5°, Plot type = height. g, Higher resolution image from f showing the mature mesh. DS = 34 nm, (comparison to Fig 1b). h, Concentric rings on tarO mutant (comparison to ED2e), DS = 46 nm. Direct comparison between the WT and tarO mutant shows that there is no substantial difference in the organization of the cell wall in the absence of WTAs and that the features observed in the WT are not WTAs. i, S. aureus ltaS mutant cells in an SH1000 background were purified and a sacculus with its external PG structure facing upwards is shown here. DS = 121 nm. j, Higher resolution image from within i highlighting the nascent PG structure of this sacculus with similar features to those seen in the WT. DS = 14 nm. k, Higher resolution image from within i corresponding to the mature PG structure of this sacculus with no apparent difference from the same structure observed in the WT cells (see Fig 2b as an example). DS = 33 nm. This direct comparison between the WT and ltaS mutant shows that there is no apparent difference in the organization of the cell wall in the absence of LTAs (lipoteichoic acids) and that the features observed in the WT are not attributable to LTAs or WTAs so must be peptidoglycan. l, 3D view of the S. aureus cell that images m-n were taken from. DS = 398 nm, 3D details: Z aspect ratio = 0.5, Pitch = 35°, Light rotation = 36°, Light Pitch = 40°, Light Intensity = 60%, Plot type = mixed. m, Image showing periodic features along the glycan chain direction (white arrows pointing at single glycan strands clearly showing the periodicity). DS = 14 nm. n, Higher resolution image from m (dashed white square) showing the 3.7 nm periodicity. DS = 10 nm. o, Profile taken along the blue rectangle in n, showing a 4 nm separation between adjacent features. We suggest the periodic bumps are uncross-linked penta-peptide side chains presented at the surface every helical repeat. p, Schematic of the helical repeat of peptidoglycan, with statistics from 24 measurements similar to those in o, mean ± s.d. is 3.7 ± 0.8 nm for the periodicity. This is in agreement with NMR data, (see reference 18 in the main text). The morphologies from a-d and l were also detected each in at least 5 other biological independent repeats, similar features to those in m-n in at least 3 biological repeats (see repository); from e-g two biological independent repeats were performed. h-k come from one biological repeat.

