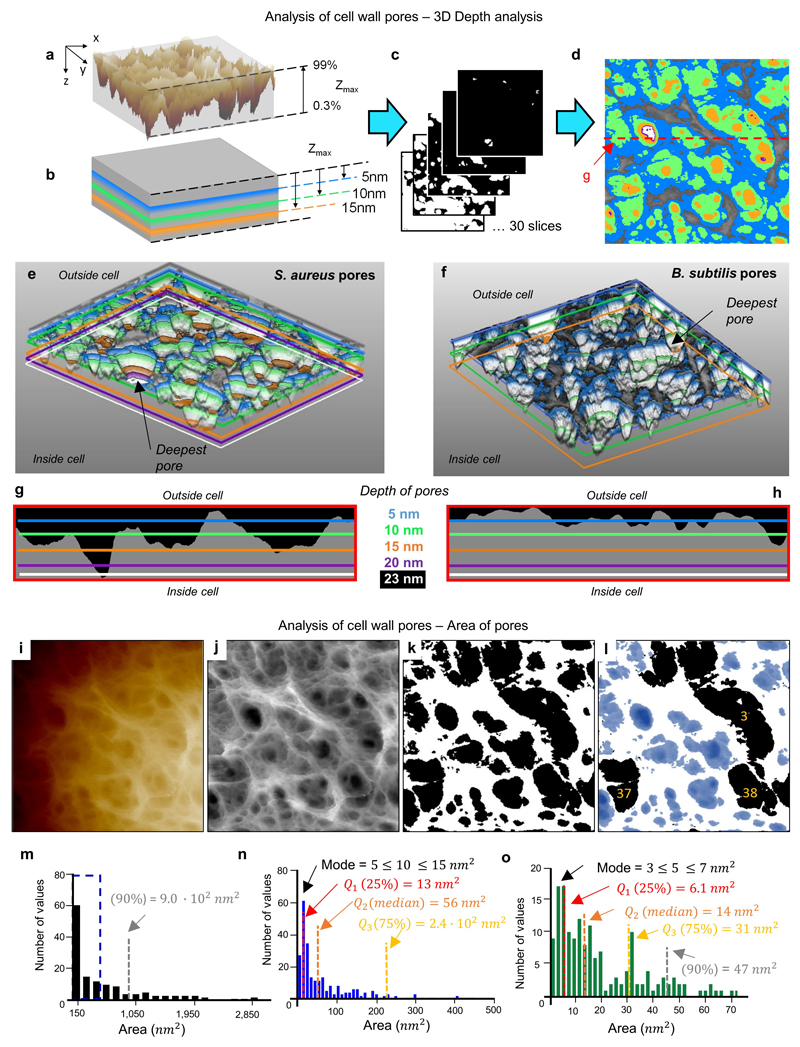
Extended Data Figure 5. Quantitative analysis of pores.
a, Image ED2g of the mature PG structure from an S. aureus live cell image represented in 3D and then tilted. The lateral resolution is lost and no clear information about the pores is visible with this representation. Therefore, a new analysis method was designed. The first step is to measure the maximum depth of this 3D image, the Zmax is calculated neglecting the areas below 0.3% and above 99% because they might contain artefacts and signal errors from the AFM. b, a two dimensional sectioning process is performed in the XY plane going down from Zmax highlighting a set of certain depths. c, Slices were taken at intervals of approximately 3% of the total Zmax, including slices with the selected depths from b. d, All slices of different depths were super-imposed on top of the original image ED2g, five of the slices are highlighted in different colours (blue = 5 nm, green = 10 nm, orange = 15 nm, purple = 20 nm and white = 23 nm) showing the different areas covered by different depths. This is the complete image from which Fig 1c in the main text was cropped. e, After converting all the slices into a stack of images in ‘.tiff’ format, AvizoLite™ software was used to represent the pores’ shape in 3D (view from the bottom) and the chosen set of depths were marked with the same colours as in d; a black arrow highlights the deepest pore in this image. f, This procedure was repeated for the mature PG structure from B. subtilis live cell, image ED7d. The 2D version of f, analogous to d, is shown in Fig 3d in the main text. Again the deepest pore in the 3D representation is marked with a black arrow. g-h Show a direct comparison of lateral slices in the XZ plane, so that the lateral profile of the pores can be visualised. Peptidoglycan is coloured grey in these images. The lateral slice from S. aureus is extracted from the red dashed line marked in d and for B. subtilis it corresponds to the black dashed line in Fig 3d in the main text. i-k show the steps followed to quantitatively compare the area of the pores on the outside of the cell and the inside of purified peptidoglycan. i shows the raw data extracted from the AFM. j, The image has been processed with the Nanoscope Analysis software (3rd order Plane-fit) to remove the offset, tilt and curvature of the cell. The image has been converted to greyscale, and a despeckle filter (3x3 median filter) has been applied with ImageJ/Fiji (see reference 38 in Methods). k, A 2D slice in the XY plane was made at a depth of 50% of Zmax for 6 images of live S. aureus and 4 images of internal S. aureus sacculi using the ImageJ/Fiji threshold tool. Slices were then binarised with pores in black and peptidoglycan in white. The “analyse particle” tool from ImageJ/Fiji was used to measure the pores. This outputs a list of individual pores with their associated area and a number for each pore. l, In some cases, in particular when several pores lie within a larger depression on the surface, pores are artificially merged. These were manually removed from the dataset by comparing the binary image with the grey scale image. Correctly assigned (retained) pores are shown in blue, three artificially merged (discarded) pores are shown in black. m-o, Histograms of pore area. m, Pore area histogram calculated for 310 pores from 6 separate images for the external surface of live S. aureus cells. The bin width is 150 nm2. n, A subset of the same dataset as m (denoted by the blue dashed box) binned at 10 nm2 intervals. o, Pore area histogram calculated for 158 pores from 4 separate images of the internal surface of S. aureus sacculi, binned at 2 nm2 intervals. The distributions of pore area are non-normal and positively skewed for both the internal and external surfaces. 90% of the pores in the external surface have area < 900 nm2 (grey dashed line in m). For the internal surface, 90% of the pores have area < 47 nm2 (grey dashed line in o). The mode and quantiles Q1-3 (25, 50 and 75% respectively) are marked on the figure distributions in n and o with dashed lines.

