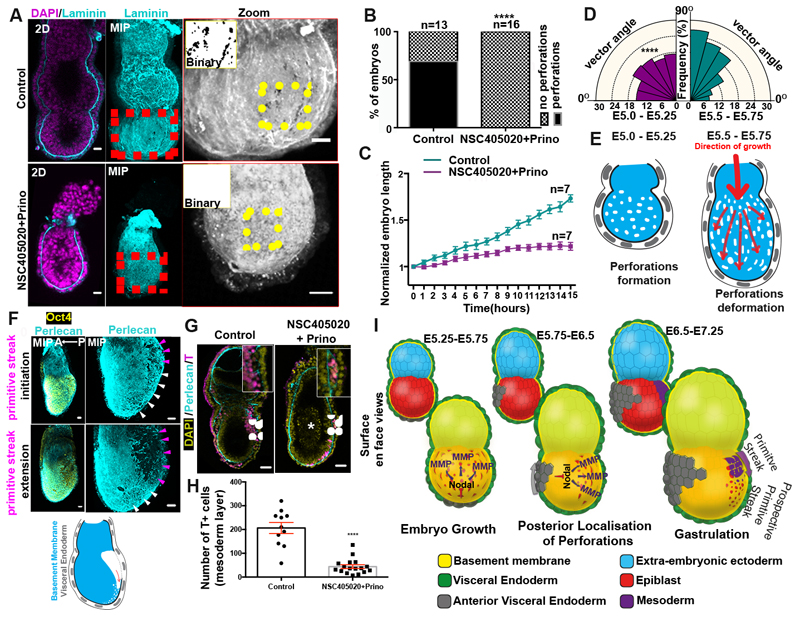
Figure 4. MMP-mediated basement membrane remodelling permits growth and primitive streak extension.
A) Control(n=13) and MMP inhibitors-treated embryos(n=16). B) Quantification of basement membrane perforations. χ2 test: ****p<0.0001. C) Quantification of embryo length over time. mean±SEM. D) Rose diagrams for vectors angles in E5.0-E5.25 (before growth) and E5.5-E5.75 (during growth) embryos. E5.0-E5.25: n=10 embryos, 1288 vectors; E5.5-E5.75: n=10 embryos, 1481 vectors. Kolmogorov-Smirnov test: ****p<0.0001. E) Model for the correlation between basement membrane perforations and embryo growth. F) Representative E6.5 embryos. White arrowheads: prospective Primitive streak (PS). Purple arrowheads: PS/breached basement membrane. n= 30 embryos. Schematic: ‘run in the stocking’ model for PS extension along the perforations’ domain G) Representative examples of embryos cultured (18 hours) from early E6.5 (pre-PS stage); Scale bars:50um; White arrows: PS; White asterisk: dead cells. H) Quantification of gastrulation progression. Two sided unpaired student’s t-test; ****p<0.0001; mean±SEM. n for G and H=11 control, 17 MMP inhibitor-treated embryos I) Model for regulation of basement membrane remodelling until gastrulation. Scale bars for A,C,H = 20um.

