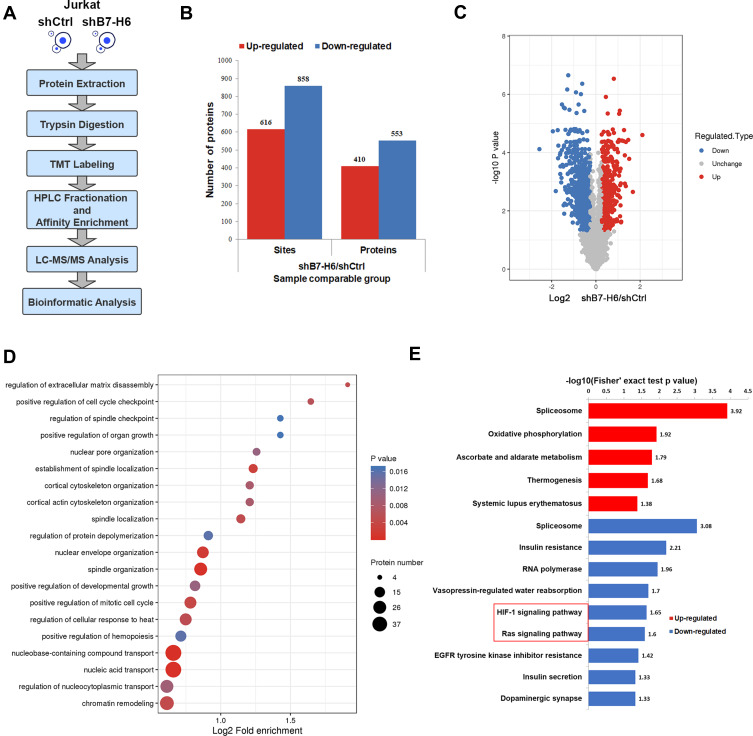
Figure 4.
B7-H6 altered phosphorylation patterns. (A) Workflow of phosphoproteomic analysis. (B and C) Histogram and volcano plots of the quantified up-regulated and down-regulated phosphosites and proteins. (D) Bubble map of GO enrichment analysis of phosphoproteins based on biological process. (E) Up-regulated and down-regulated pathways of KEGG pathways enrichment analysis for altered phosphoproteins.

