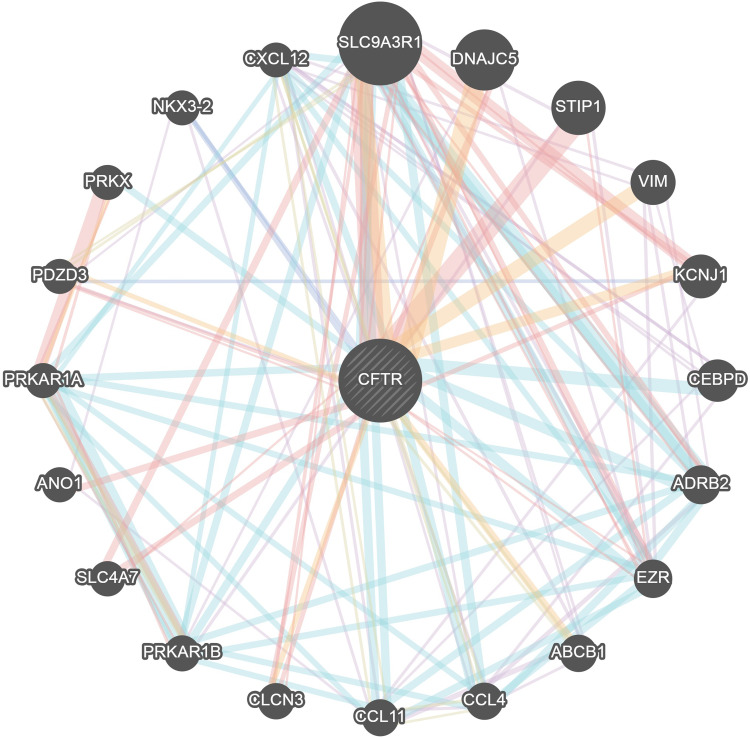
Figure 6.
Protein–protein interaction network of CFTR (GeneMANIA). Different colors of the network edge indicate the bioinformatics methods applied: co-expression, website prediction, pathway, physical interactions and co-localization. The different colors for the network nodes indicate the biological functions of the set of enrichment genes.

