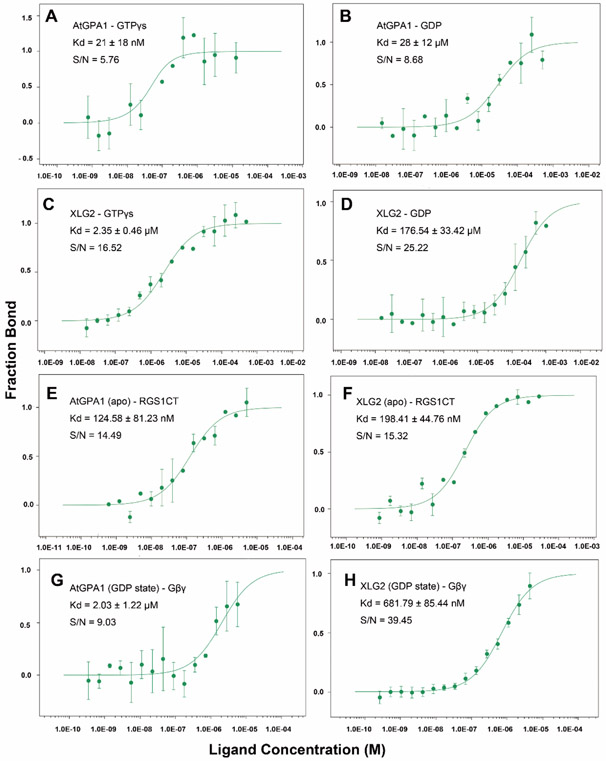
Figure 4. Binding isotherms for nucleotide, RGS1-C domain and Gβγ to AtGPA1 and XLG2.
Microscale Thermophoresis was used. (A) Binding isotherm and Kd value of AtGPA1 binding GTPγS and (B) GDP. (C) Binding isotherm and Kd value of XLG2 binding GTPγS and (D) GDP. (E) Binding isotherm and Kd value of RGS1 C terminal domain to AtGPA1 apo state and (F) XLG2 apo state. (G) Gβγ binding to AtGPA1 and (H) XLG2 Gα domain. S/N: signal to noise ratio. Each experiment was repeated at least once. Binding curve and Kd were fitted as described in Methods. Error bars represent StdDEV. Each experiment was repeated at least once.

