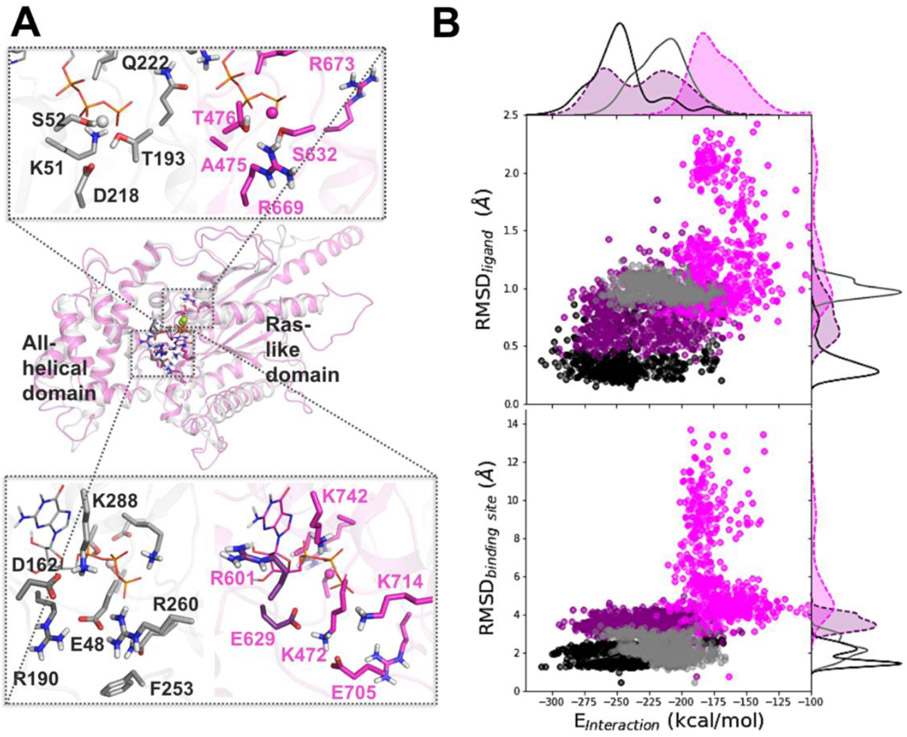
Figure 5. Difference in dynamics between the nucleotide-bound AtGPA1 and XLG2: Insights from MD simulations.
Homology modeling and MD simulations reveal the main differences in amino-acid residue composition and the nucleotide binding site dynamics of AtGPA1 (grey) and XLG2 (magenta) (A) Aligned minimized AtGPA1 crystal structure (PDB ID 2xtz) and the homology modeled XLG2. The zoomed in plots separately display phosphate and Mg2+ binding site (top) and guanine and ribose binding site (bottom) on the example of GTP-bound complexes, highlighting the most prominent differences in the amino-acid residues. (B) The relationship between the nucleotide-protein interaction energies (designated as Einteraction on the scatter plots, and calculated as the sum of the Coulomb and LJ terms) and mobility of the nucleotide (RMSDligand) and binding site (RMSDbinding site) display substantial separation among AtGPA1-GTP (black points and solid line), XLG2-GTP (purple points and dashed line), AtGPA1-GDP (grey points and solid line), and XLG2-GDP (pink points and dashed line) complexes (Fig. S6-8).

