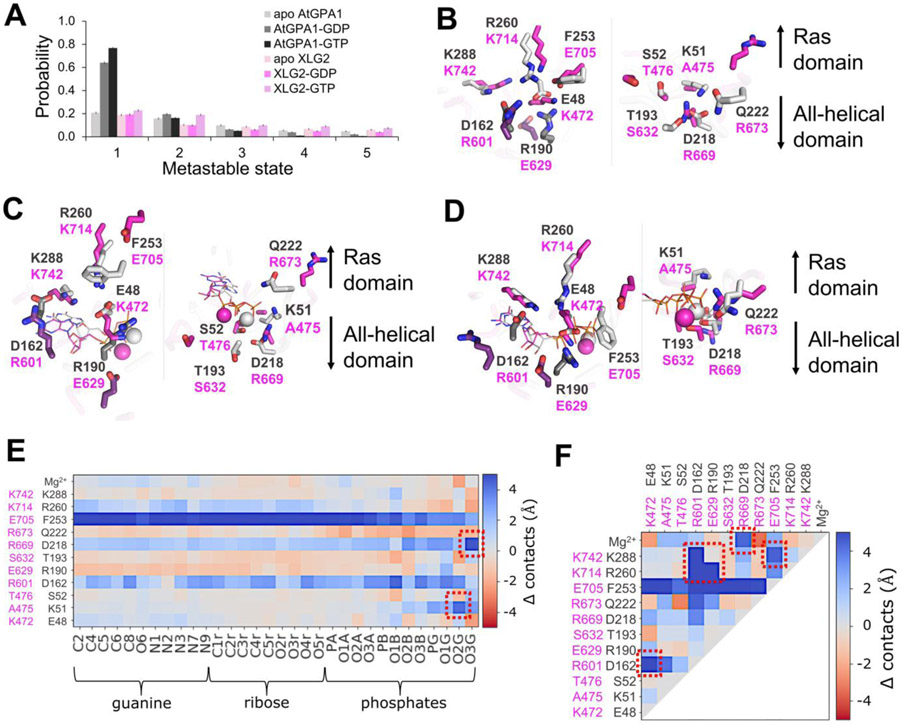
Figure 6. Apo and nucleotide-bound proteins obtain distinct configurations defining the nucleotide binding preferences of AtGPA1 and XLG2.
(A) The top five most populated metastable states of the nucleotide binding site obtained in cluster analysis of MD trajectories indicate that nucleotide-bound AtGPA1 obtains a stable frequently visited conformational state, whereas XLG2 complexes tend to transition between conformationally diverse states with lower probabilities. Interestingly, both apo proteins obtain multiple states with equivalently low probabilities (Fig. S6,S9). Aligned centroids of the largest metastable states are presented in panels B-D. (B) The most populous apo states show stable E48-R190-R260 and D162-K288 salt bridge networks in the guanine binding site (left image) of AtGPA1 (grey), and a more destabilized salt bridge network between similarly positioned residues in XLG2 (magenta) primarily contributed by R601-K742 electrostatic repulsion. K51-D218 salt bridge in the phosphate and Mg2+ binding sites (right image) enables a more structures AtGPA1, while the neutral A475 and a repulsion between R669 and R673 cause a more disintegrated XLG2. (C) GDP- and (D) GTP-bound complexes retain the strong salt bridge network in AtGPA1 and less stable electrostatic interactions in XLG2. K51 reorients and forms an additional bond with phosphates in AtGPA1, which is prevented by the equivalently positioned neutral A475 in XLG2. K472 breaks its bonds with E629 and re-arranges to interact with closer located phosphates. The absence of γ-phosphate in GDP makes the nucleotide more mobile, losing the frequency of its contacts. R673 in GTP-bound XLG2, however, forms a relatively stable bond with the γ-phosphate seemingly increasing the nucleotide binding affinity. The residues shown in darker shades in panels B-D (D162 and R190 of GPA1; R601 and E629 of XLG2) make the key intra-protein interactions defining the binding site shape. The differences in the frequency of the aforementioned interactions, on the example of GTP-bound complexes, are clearly seen through heatmaps of Δ contacts (minimum distances) (E) between the non-hydrogen atoms of the nucleotide and binding site residues, and (F) within the binding site residues. 100 states of the most populated clusters were used to generate the heatmaps. The red squares highlight the most prominent changes in the interactions stipulating the importance of the residues to the stability of the active sites and to the interactions with the nucleotide.

