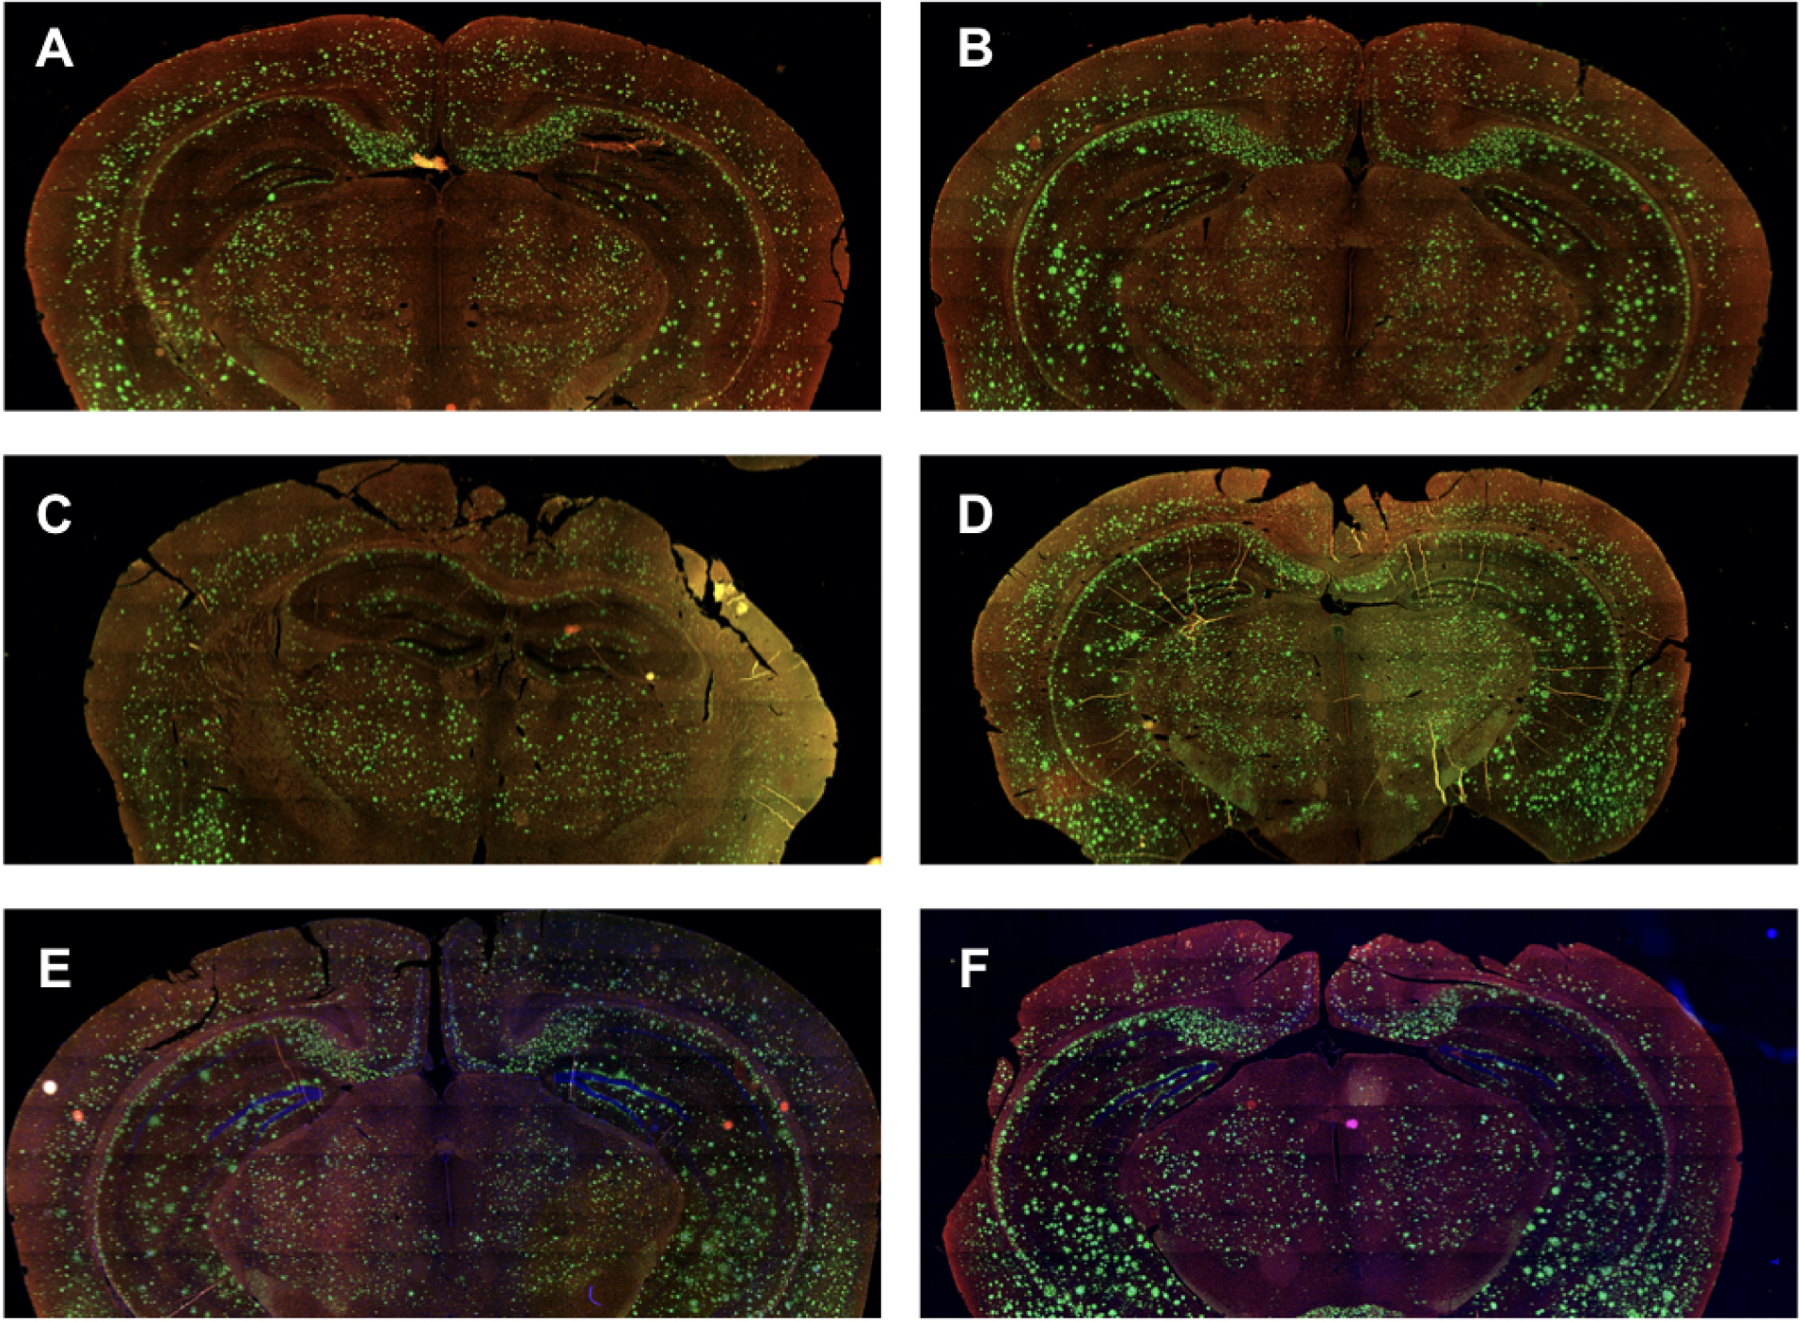
Figure 6. Sample histology of Aβ plaque burden for chronically treated versus sham treated AD mice.

Representative Aβ plaque burden (green) and microglia (red) in treated (left column) and corresponding sham treated (right column) mouse brains. Note the following correspondence between image pairs here and the quantitative analysis results in Table 3. (A) This image corresponds to treated mouse #2 while (B) corresponds to sham treated mouse #2. Together, this pair has the smallest difference in integrated Aβ plaque burden (14.5 +/− 2.6%). (C) This image corresponds to treated mouse #4 while (D) corresponds to sham treated mouse #4. Together, this pair has the largest difference in integrated Aβ plaque burden (66.8 +/− 3.0%). (E) This image corresponds to treated mouse #5 while (F) corresponds to sham treated mouse #5, another image pair with a large difference in integrated Aβ plaque burden (62.9 +/− 0.9%). Overall, we observed a statistically significant reduction in Aβ plaque burden for the treated versus sham mice (47.4 ± 5.8%, z 1/4 − 2.79, p < 0.0005)
