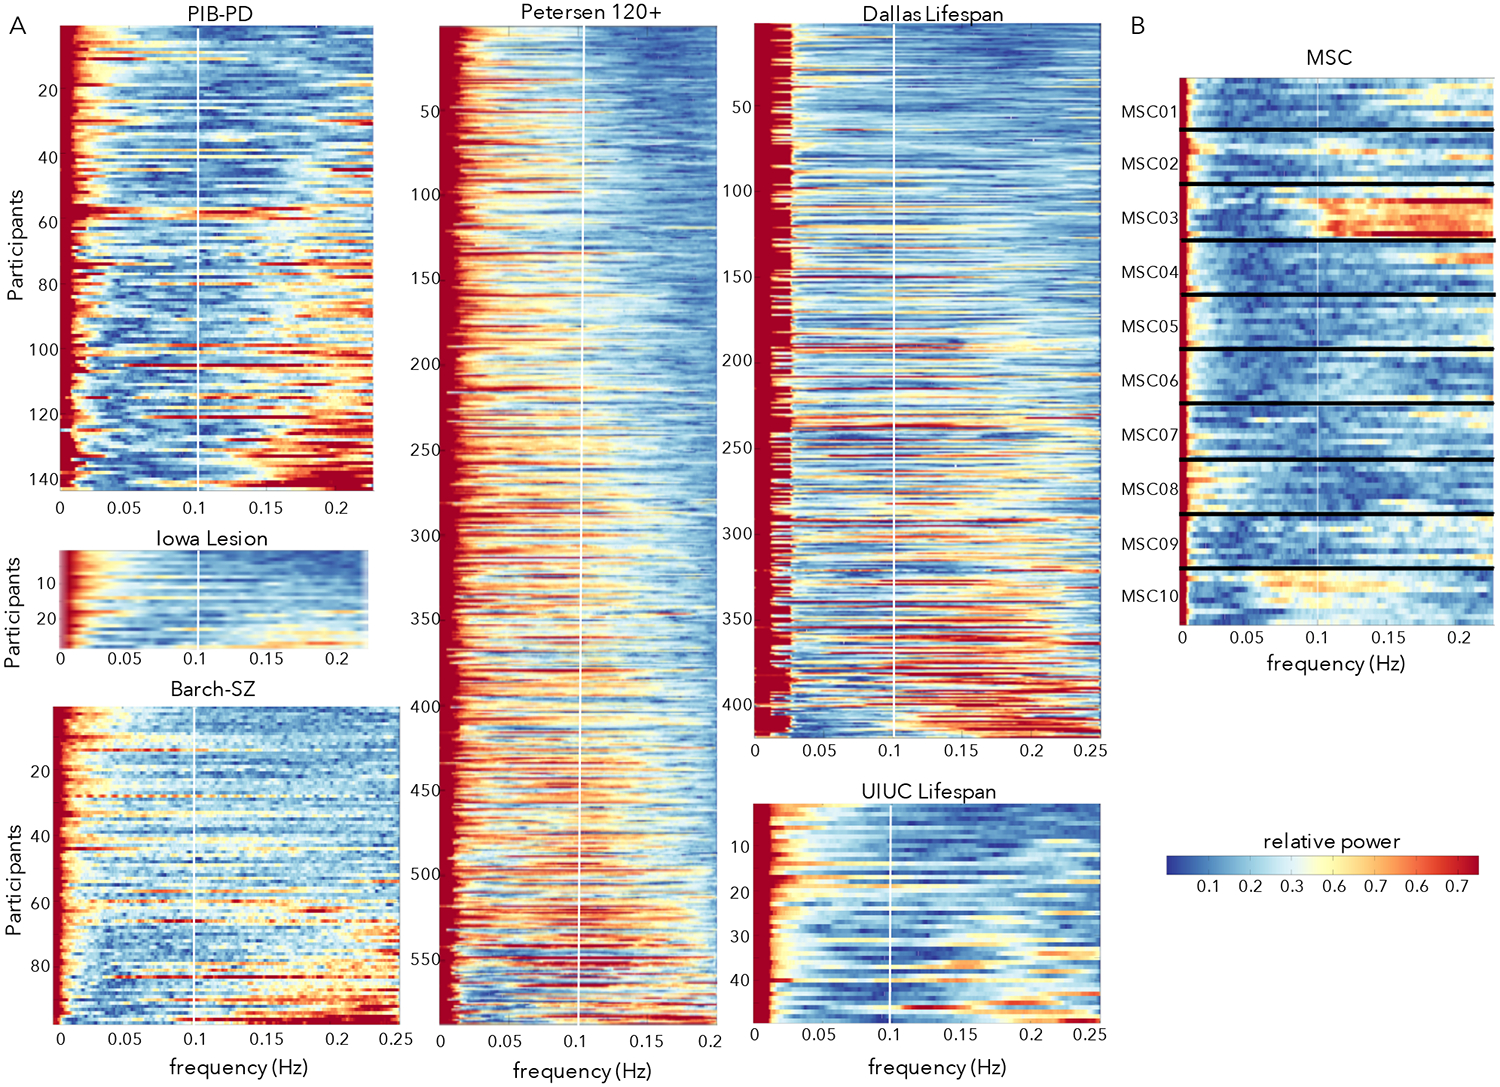
Figure 2:

Power spectra of the y-translation (phase-encoding) motion parameter across diverse datasets. (A) Power spectra in six datasets with TR from 2 – 2.5 collected at multiple sites and in different populations. Participants are ordered based on their proportion of HF-motion. The white line marks 0.1 Hz; at these sampling frequencies respiratory effects in adults would typically alias into the 0.1 – 0.2 Hz range (above the white line). A set of participants in each dataset show peaks in power above 0.1 Hz. (B) Power spectra from 10 sessions in the 10 MSC subjects. For a given participant, each row depicts a single scan session and subjects are separated by horizontal black lines. HF-motion shows some consistency across sessions, with participants who exhibit the strongest HF-motion (e.g., MSC03) showing strong HF-motion in most repeated sessions (e.g., note similarity in frequency profile of motion parameters across repeated scans – stacked lines – from the same subject; MSC03 has 8/10 sessions with >67% of power in the y-translation above 0.1 Hz; other subjects show 0–1 sessions).
