
Figure 3:
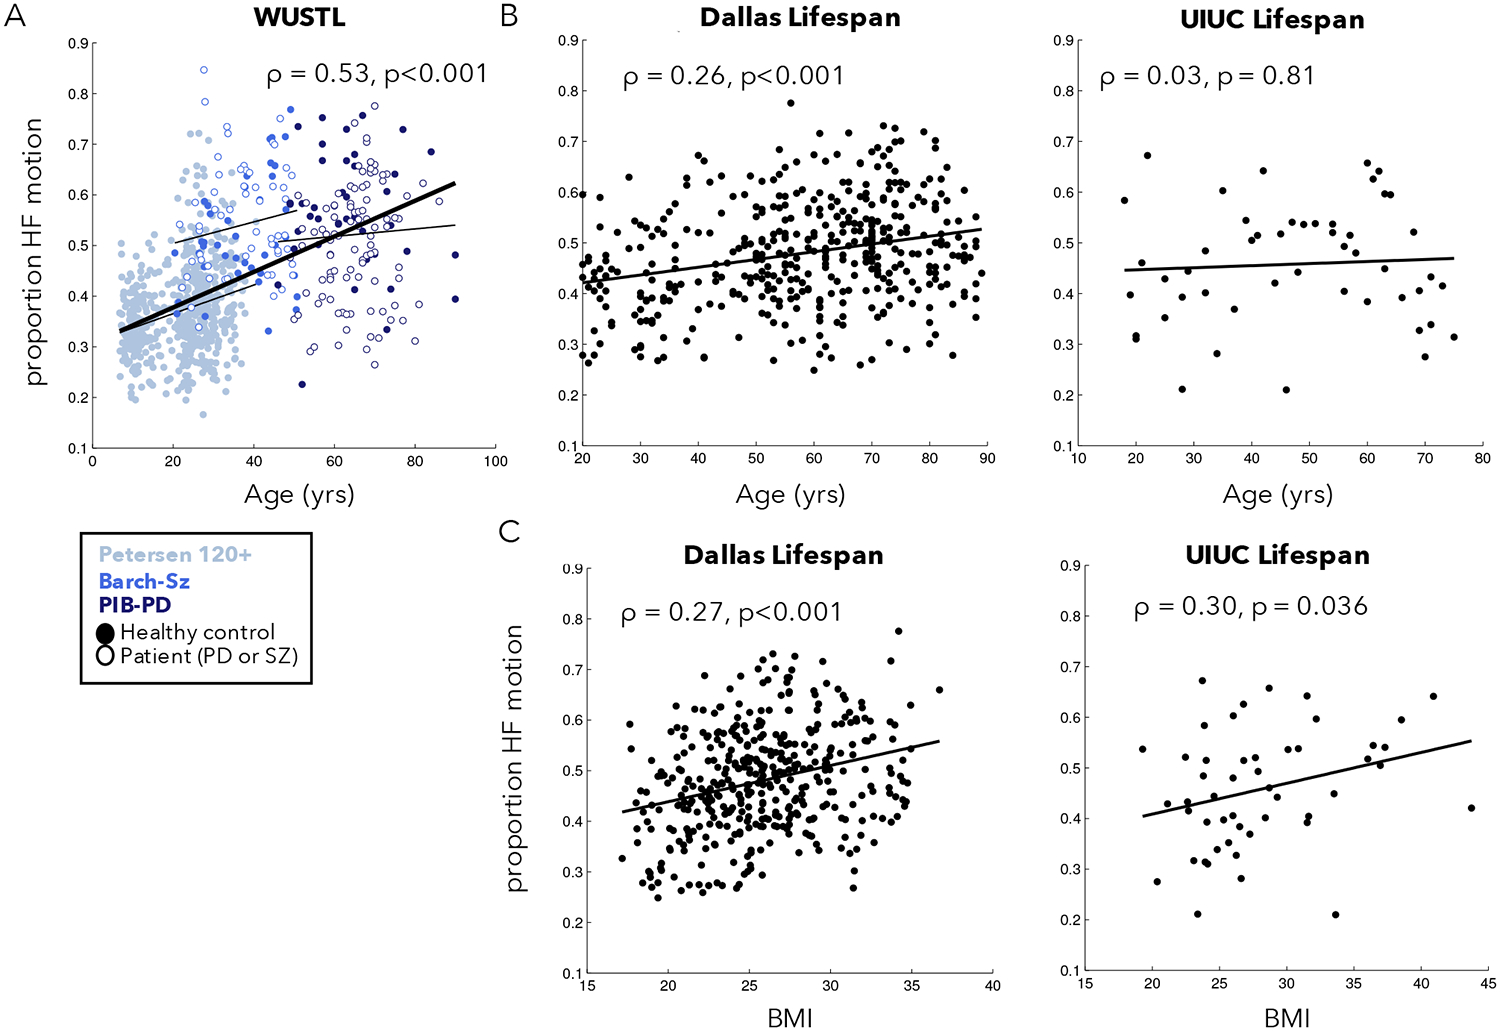
Relationship between phase-encoding HF-motion and participant age and BMI. (A) HF-motion showed a significant relationship to age in a combined set of three datasets collected on the same scanner at WUSTL. Different colors represent data from different datasets, with the fit line plotted for each dataset separately as a thinner black line. Filled circles represent data from healthy controls and open circles represent data from individuals with Parkinson Disease (PD) or schizophrenia (SZ). (B) HF-motion was also related to age in the Dallas lifespan dataset, but not in the smaller UIUC lifespan dataset. (C) HF-motion was related to participant BMI in both the Dallas and UIUC Lifespan datasets. Supp. Fig. 6 shows scatter plots after correction for alternate participant characteristics.