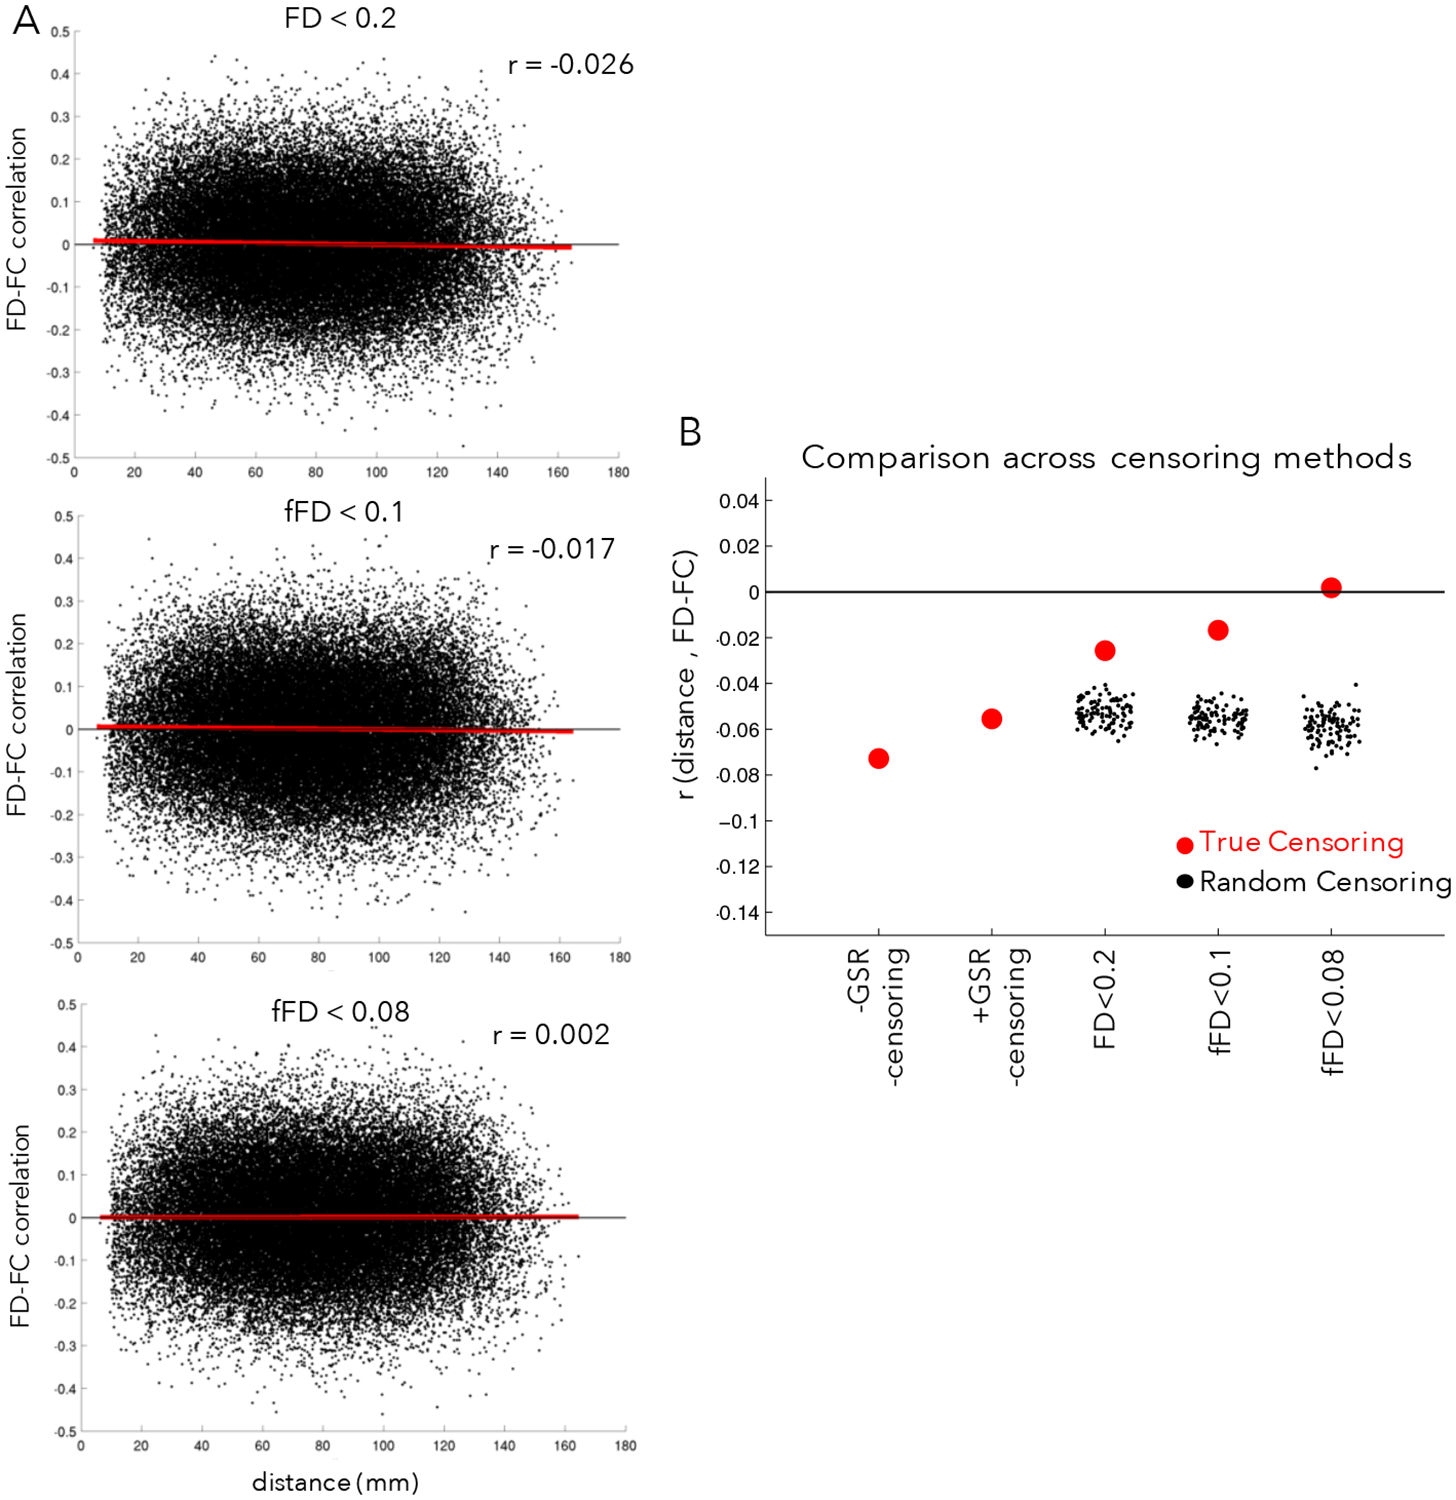
Figure 6: Relationship between motion and distance in FC.

(A) The x-axis plots the distance between a pair of regions and the y-axis plots the correlation between the FC of those regions and motion (mean fFD) across participants for each pair of regions (black points), as in (Ciric et al., 2017). The red line shows the linear fit. In the absence of correction, head motion typically leads to elevated FD-FC relationships for regions close together in space and relatively dampened FD-FC relationships for regions far apart, leading to an overall negative slope. In the top plot, censoring has been conducted using an FD < 0.2 criteria, in the middle plot using a filtered FD < 0.1 criteria, and in the bottom plot using a filtered FD < 0.08 criteria. (B) Summary of the average distance-dependent correlations across censoring strategies (red dots); for comparison, we also computed distance-dependent relationships with random censoring (black dots). Filtered FD censoring criteria do well at removing distance-dependent bias in functional connectivity (relative to FD<0.2 censoring, random censoring, or absent censoring) while retaining substantially more data. For variations on these analyses, see Supp. Fig. 13.
