Figure 3.
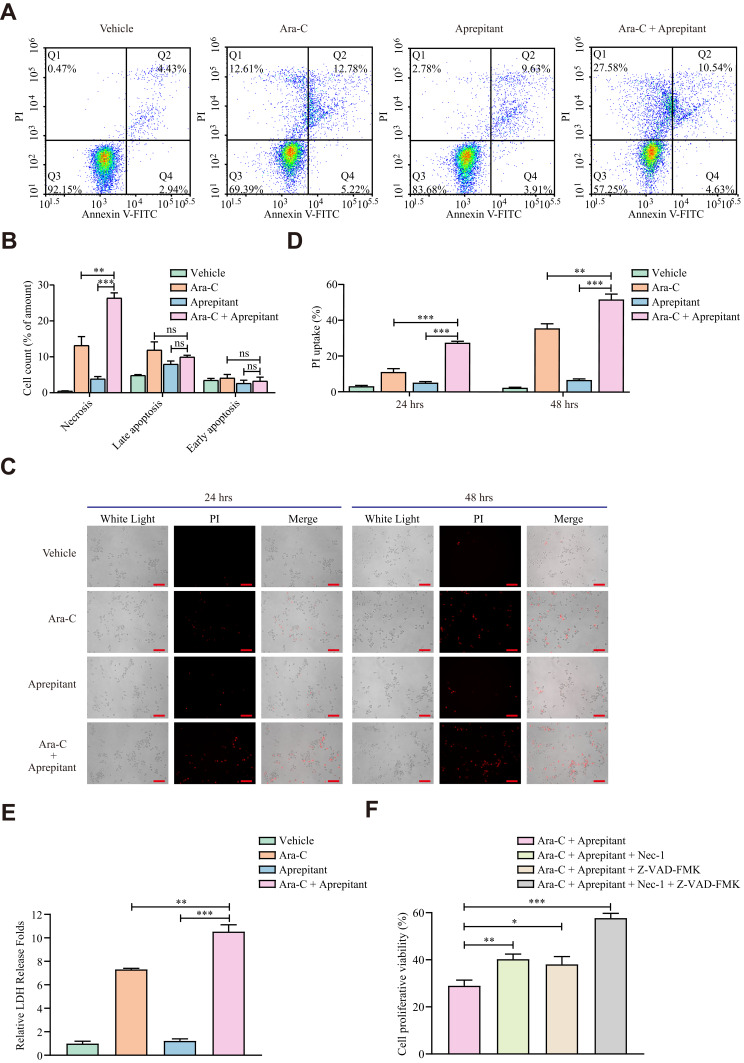
Aprepitant enhances necrosis of HL60 cells treated by Ara-C. (A) Representative images of apoptosis or necrosis for HL60 cells were measured by flow cytometry after treatment with 0.8 μM Ara-C, 10 μM Aprepitant, and the combination of two drugs for 24 hours. (B) The statistical results of cell death including necrosis (Q1 area), late apoptosis (Q2 area) and early apoptosis (Q4 area) detected by Annexin-V plus PI analysis. Values represent mean ± SEM (n = 3). ns: not significant; **P<0.01, ***P<0.001, compared with each indicated group. (C) Microscopic recording of the cell numbers of PI uptake by PI staining after treatment with 0.8 μM Ara-C, 10 μM Aprepitant, and the combination of two drugs for 24 hours and 48 hours. Scale bar, 50 μm. (D) The percentage of PI uptake cells was indicated by the cell numbers of PI uptake/the total numbers. Values represent mean ± SEM (n = 6). **P<0.01, ***P<0.001, compared with the indicated group. (E) The LDH release of HL60 cells was measured by LDH-Cytotoxicity Assay after treatment with 0.8 μM Ara-C, 1 μM Aprepitant, and the combination of two drugs for 24 hours. The relative LDH release folds were indicated by the value of drug treatment group/the value of Vehicle group. Values represent mean ± SEM (n = 3). **P<0.01, ***P<0.001, compared with the indicated group. (F) The HL60 cells were pretreated with Nec-1 (20 μM), Z-VAD-FMK (50 μM) or Nec-1 and Z-VAD-FMK for 1 hour. Cell viability was measured by MTT assay after treatment with 0.8 μM Ara-C and 10 μM Aprepitant for 24 hours. Values represent mean ± SEM (n = 6), *P<0.05, **P<0.01, ***P<0.001, compared with the indicated group.

