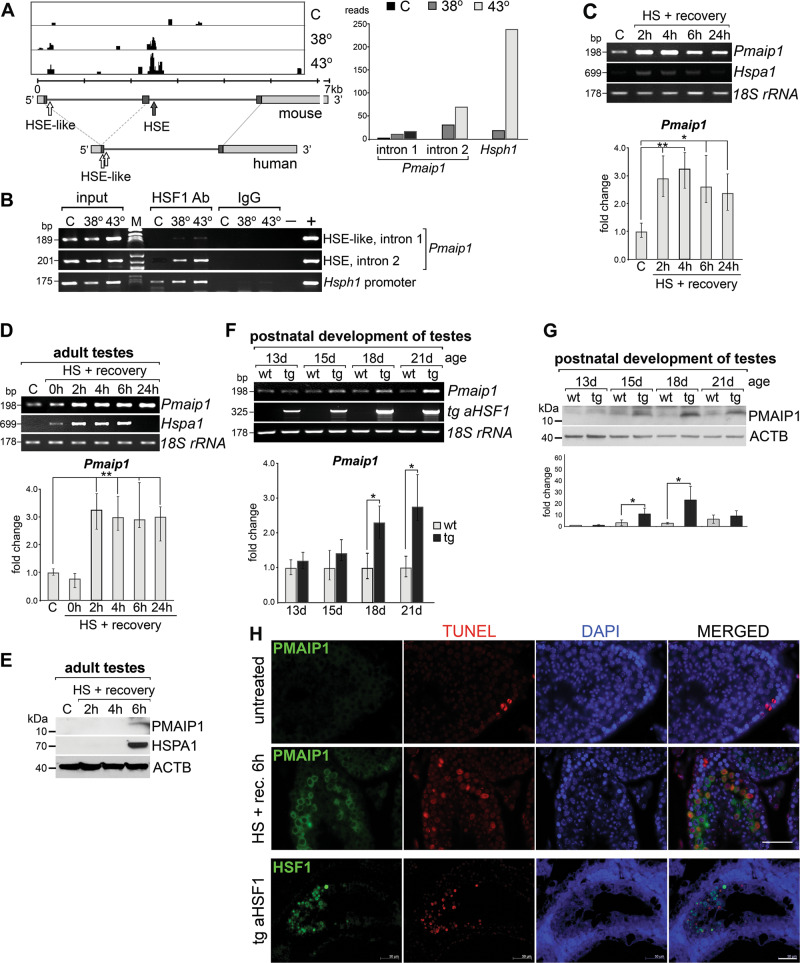
Fig. 1. Heat shock-induced HSF1 binding in the introns of the Pmaip1 gene correlates with upregulation of its expression and enhanced apoptosis in mouse spermatogenic cells.
a Chromatin binding of HSF1 assessed by ChIP-Seq in isolated spermatocytes. Organization of mouse and human genes is shown below peaks of ChIP-Seq tags: bars—exons (darker bars—coding regions), lines—introns; corresponding start and stop codons are linked by light-gray dashed or solid lines, respectively; the positions of HSE or HSE-like motifs are indicated by the closed and open arrows, respectively. Right panel shows the magnitude of HSF1 binding in intronic HSE of the Pmaip1 gene in comparison to Hsph1 promoter based on data from ChIP-Seq extracted from GSE56735. b HSF1 binding in Pmaip1 introns analyzed by ChIP-PCR in isolated spermatocytes. Binding to the Hsph1 promoter is shown as a positive control. C control, physiological temperature of testes (32 °C); 38° and 43°, heat shock at 38 or 43 °C, respectively; M marker; − +, negative and positive PCR controls. c Induction of Pmaip1 transcription assayed by RT-PCR and RT-qPCR in isolated spermatocytes after heat shock in vitro at 43 °C and d in testes of mice after heat shock in vivo. 18S rRNA and Hspa1 were used as transcript level controls for loading and the heat shock response, respectively; C control, HS heat shock. e Accumulation of PMAIP1 protein after heat shock in vivo in mouse testes demonstrated by western blot. ACTB and HSPA1 were used as controls for loading and the heat shock response, respectively. f Induction of Pmaip1 transcription assayed by RT-PCR and RT-qPCR in testes of transgenic mice expressing constitutively active mutated HSF1 (aHSF1) during postnatal development; wt wild type, tg transgenic. Asterisks on the graphs indicate statistical significance of differences: *p < 0.05, **p < 0.001. g Accumulation of PMAIP1 in transgenic mouse testes demonstrated by western blot. ACTB was used as a control for loading. h Detection of PMAIP1 or HSF1 by immunofluorescence (green) and apoptotic DNA breaks (by TUNEL assay, red; DNA stained with DAPI, blue) in seminiferous tubules (stages IX–X) of untreated mice and after 6 h of recovery from heat shock in vivo (PMAIP1; upper panels) or the aHSF1 transgenic mouse (HSF1; bottom panel). Scale bar—50 µm.

