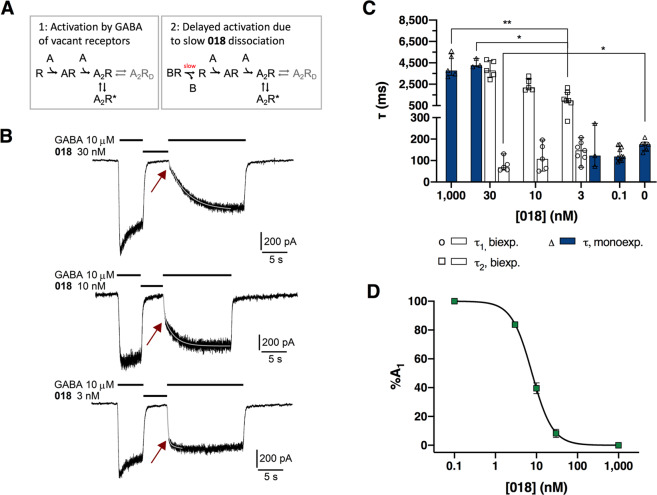
Figure 4.
Compound 018 displays slow dissociation kinetics. (A) Simple kinetic models for the activation by GABA of vacant receptors (Model 1) and receptors initially blocked by 018 (Model 2), respectively. When present, dissociation of 018 is the slowest (rate-limiting) step and delays the overall process of activation by GABA. Openings are assumed to occur only with two agonist molecules bound (A2R* state) and desensitization (A2RD, in grey) to be of minor importance during the activation phase. (B) Examples of current traces for 2.5 μM GABA before and after 5 sec application of 10 nM 018 showing slow dissociation kinetics of 018. A biexponential function (grey line) was fitted to the activation phase of the current traces, with the fast component interpreted as reflecting GABA activation of vacant receptors (Model 1), and the slow component reflecting receptors, where activation had to await dissociation of 018 (Model 2). The arrow indicates the break point where the fast component is essentially completed. (C) Time constants, τ, for currents induced by 2.5 μM with or without pre-application of 018. Constants determined by fitting to a monoexponential function are shown as blue bars (Δ) and biexponential fittings in white bars (☐,○). Data are shown as median ± interquartile range for 5–10 cells. Statistical analysis was performed using Kruskal-Wallis ANOVA follow by Dunn’s multiple comparison. τ1 is compared to 0 (2.5 μM GABA without pre-application of 018) and for τ2 all values are compared. (D) The contribution from the fast-rising amplitude %A1 concentration dependently decrease for increasing concentrations of 018 using 2.5 μM GABA, giving a functional KB of 7.80 nM. %A1 was determined from the fitting a to biexponential function using data displayed in (C). The fractional amplitude of the fast component (%A1) is a measure of the fraction of receptors that are vacant when GABA is applied. For values see Table 2. Additional data for similar experiment using 100 μM GABA is given in supplementary Fig. S4 and Table S1.

