
Figure 1.
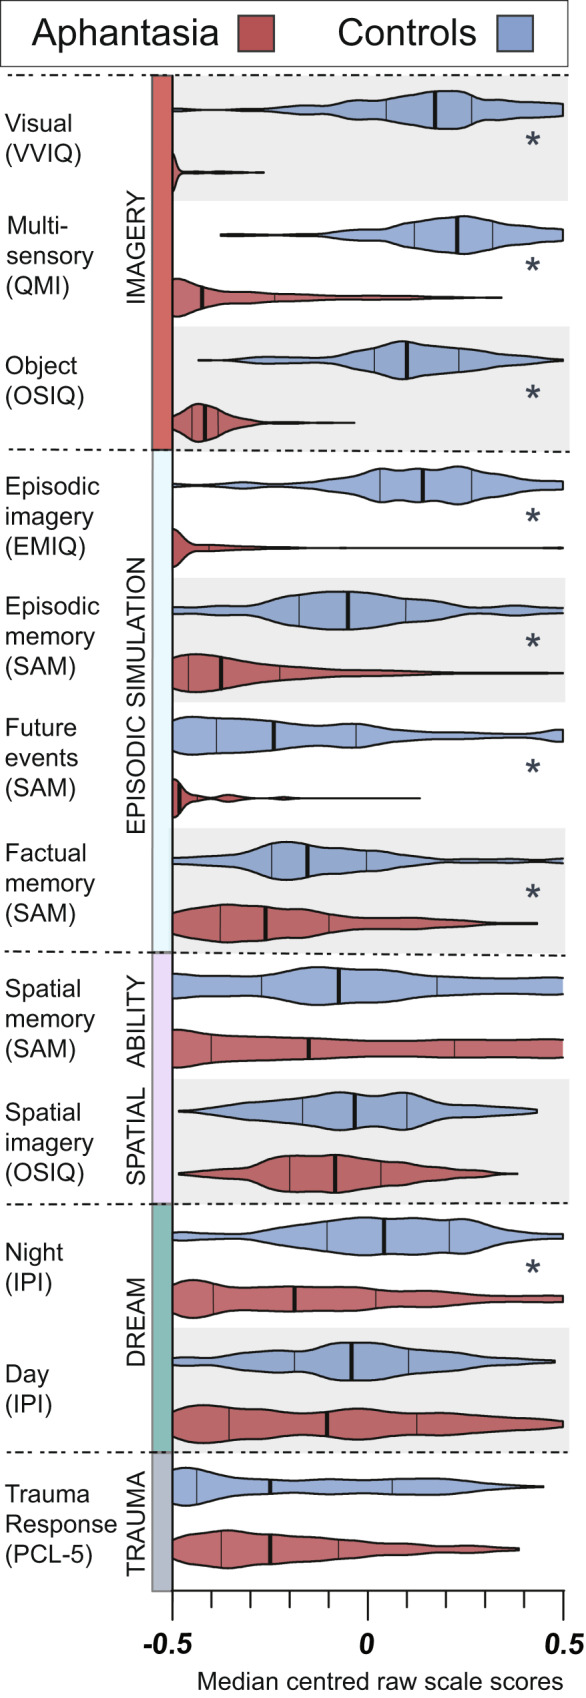
Summary of self-reported cognition questionnaires for individuals with aphantasia (red, n = 267) and control group 1 participants with visual imagery (blue, n = 203). Violin plots of median-centred scale scores with median (bold line), lower and upper quartiles (thin lines) and kernel density-smoothed frequency distribution (shaded area) coloured by group. Each pair of violin plots represents transformed raw data (see Data Transformation, Method). Stars to the right of group plot segments indicate Mann-Whitney test significance at threshold p < 0.0002.