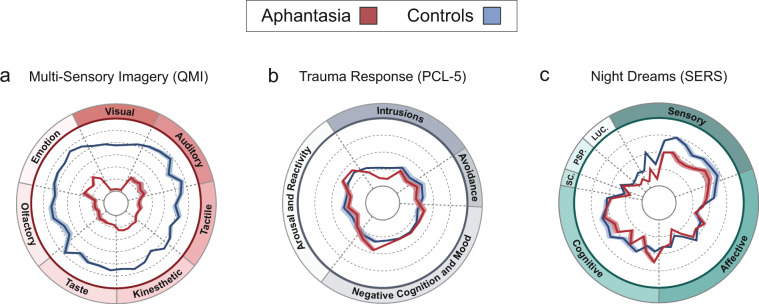
Figure 2.
Group differences in visual imagery ability on scale sub-components. Radar plots for (a) multi-sensory imagery; (b) trauma response; and (c) dreaming scales (SC. = Spatial Complexity; PSP. = Perspective; LUC. = Lucidity). Concentric dashed circles represent raw scale scores for each scale (e.g. a; 1–7 Likert-type), with lowest possible item scores falling on innermost solid circle and highest possible item scores falling on outermost coloured circle; radial dashed lines denote item grouping for scale sub-components (e.g. c; Intrusions, Avoidance, Negative Cognition and Mood, Arousal and Reactivity); central coloured lines (red = aphantasia group, blue = control group 1) represent raw total group scores on individual scale items, with translucent shading denoting standard-deviation.

