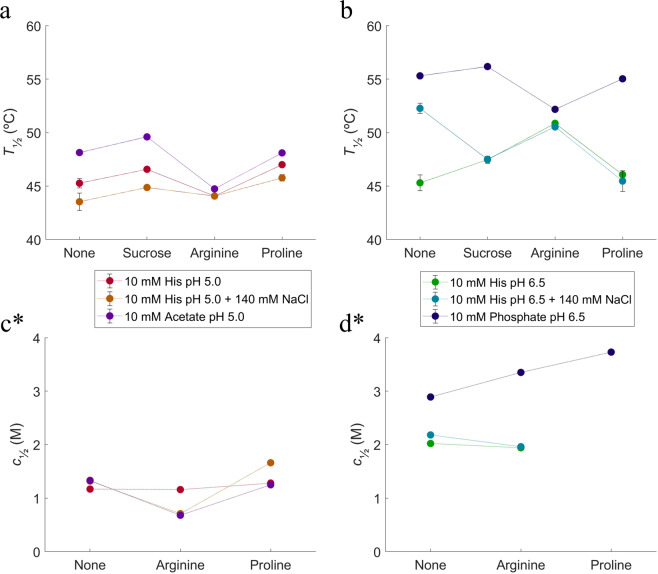
Figure 6.
NanoDSF and ICD stability studies using different buffers and excipients. (a) changes in T½ at histidine (0 and 140 mM NaCl) and acetate pH 5.0; (b) changes in T½ at histidine (0 and 140 mM NaCl) and phosphate pH 6.5; (c) changes in c½ at histidine (0 and 140 mM NaCl) and acetate pH 5.0; (d) changes in c½ at histidine (0 and 140 mM NaCl) and phosphate pH 6.5. Purple: 10 mM acetate pH 5.0, red: 10 mM histidine pH 5.0, orange: 10 mM histidine pH 5.0 with 140 mM NaCl, blue: 10 mM phosphate pH 6.5, green: 10 mM histidine pH 6.5, cyan: 10 mM histidine pH 6.5 with 140 mM NaCl. *It was not possible to perform ICD studies at pH 5.0 with sucrose and pH 6.5 with sucrose and proline, due to the crystallization of solution in high concentrations of urea.

