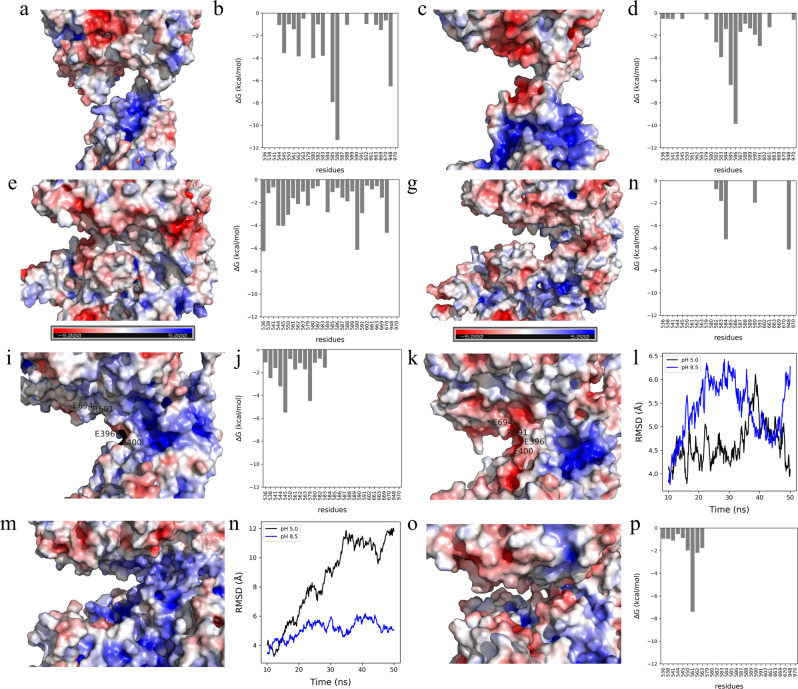
Figure 7.
Surface coloring of the representative structure from MD trajectory clustering based on the electrostatic potentials at pH 5.0 for (a) extended conformation, (e) compact1, (i) compact2, and (m) compact3; at pH 8.5 for (c) extended conformation, (g) compact1, (k) compact2, and (o) compact3 (color-scale: red, white, and blue indicates negative, close to neutral, and positive potentials. Figures were created using PyMOL25). HSA is located in the bottom and NEP in the top. Interaction energy at pH 5.0 for (b) extended conformation, (f) compact1, and (j) compact2; at pH 8.5 for (d) extended conformation, (h) compact1 and (p) compact3. RMSD plot for (l) compact2, and (n) compact3 at pH 5.0 (in black) and 8.5 (in blue).

