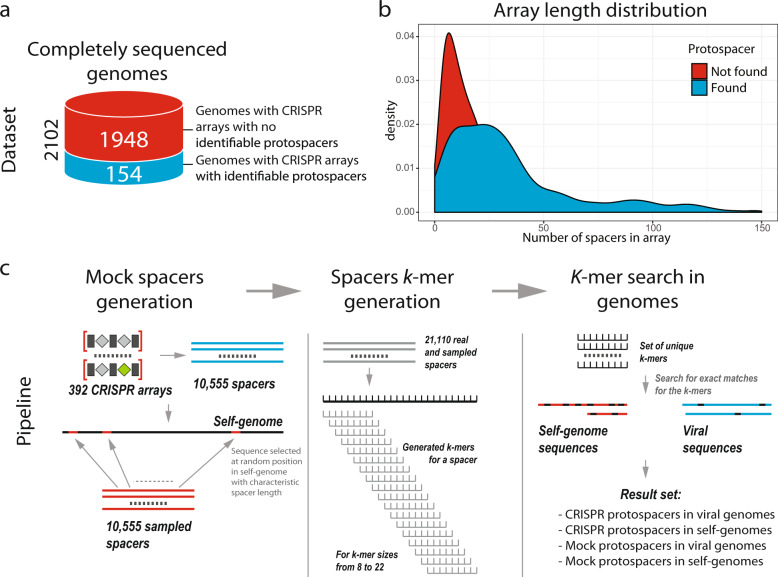
Fig. 1. Datasets and the computational pipeline for spacer analysis.
a The analyzed genomes. On the left, the green part of the cylinder shows complete genomes containing CRISPR arrays with no identifiable protospacers, and the blue part shows complete genomes containing spacers with identifiable protospacers. The schematic on the right shows a genome with CRISPR arrays, one of which contains a virus-targeting spacer. b Distributions of the number of spacers per array for arrays containing protospacers with detectable matches (blue) and arrays lacking such protospacers (red). c The computational pipeline for spacer analysis. The workflow includes the generation of mock spacers, k-mer generation, and search for k-mer matches in spacers. The underlying data are available at ftp://ftp.ncbi.nih.gov/pub/wolf/_suppl/spacers2020/.

