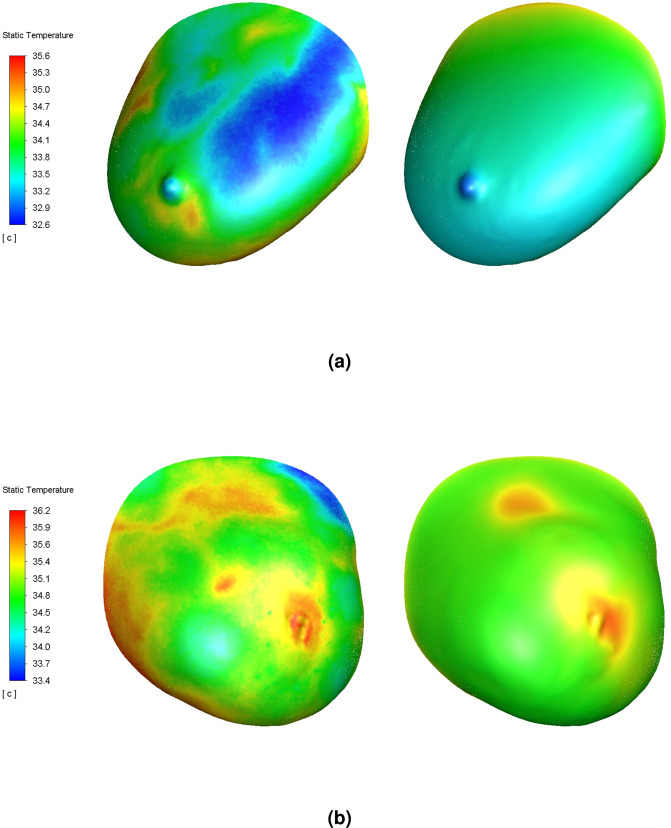
Figure 2.
Surface temperature contours of a representative solution for the right normal breast model (a) and left malignant breast model (b). Subject’s frontal IR image shown on left for each breast model for reference; temperature map placement was accurate to within 5.0 mm. Solution for = 35.5°C and h = 5.0 W/m2-K case shown; all other () solutions reported herein were similar. For the right breast model, the mean surface temperature matched the IR image. For the left breast model, the two hotspots caused by the internal cancerous mass matched the IR image. The medial hotspot, which was due to a local blood vessel and not any underlying mass, was not recreated. Lighting shown to demonstrate 3D surfaces.

