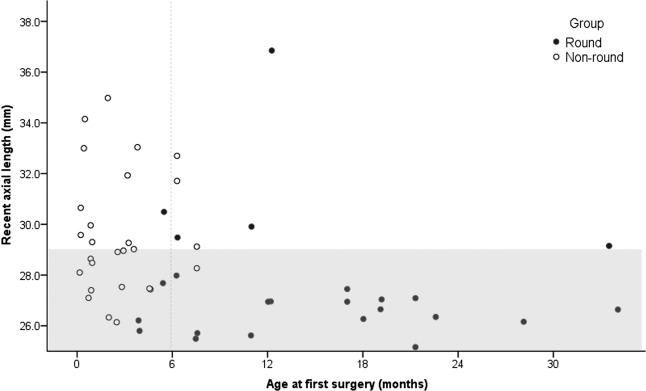
Figure 1.
Distribution of axial length and age at first surgery in the round and non-round groups of myopic congenital glaucoma patients. The graph shows the relationship between age at first surgery and axial length in two groups. The round group (black filled dots) showed a shorter axial length than the non-round group (black un-filled dots), but the effect of age on grouping is also evident. An arbitrary grey line splitting the distribution between the two groups is marked at 6 months. The shade indicates the axial length from 25.0 to 29.0 mm.

