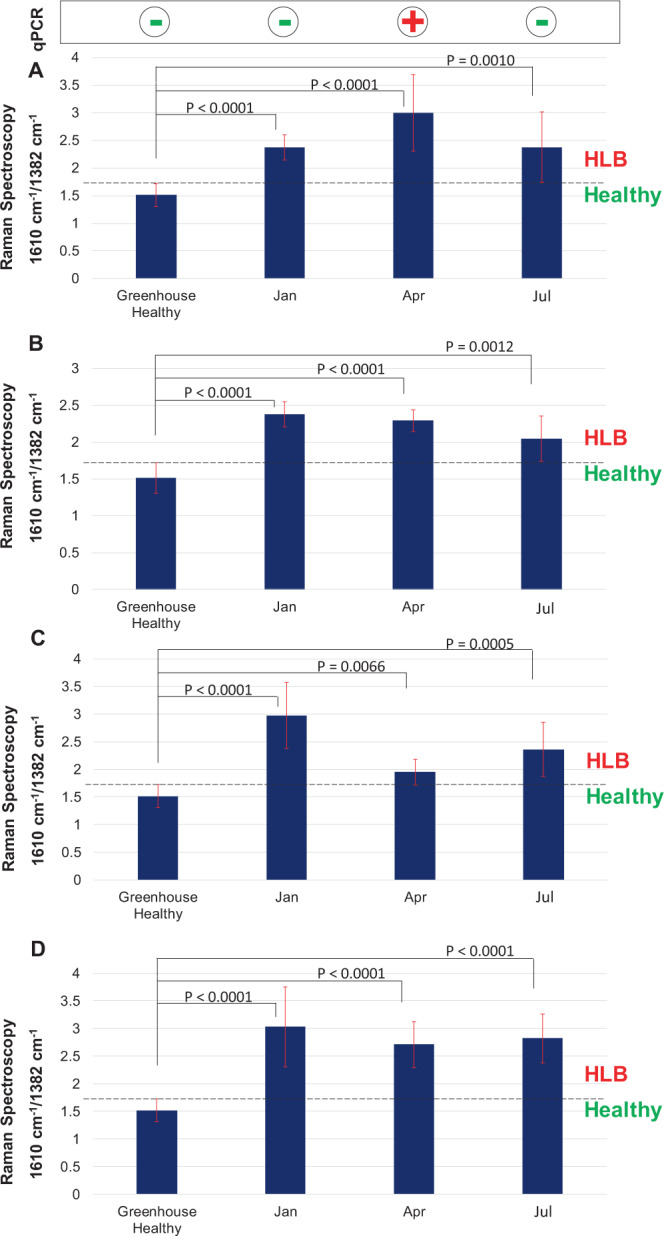
Figure 6.

Histograms of intensity of 1610 cm−1 (lignin/phenylpropanoids) band normalized to the intensity of 1382 cm−1 band (CH2 vibrations) in the Raman spectra collected from four trees (A–D) over a 6 month period. The observed intensities are compared to the intensity of 1610 cm−1 band (with identical normalization) in the Raman spectra collected from GHH trees (greenhouse healthy). qPCR status of the plants is shown on the top panel. P-values obtained from two-sample t-tests are displayed between the compared groups.
