Figure 4.
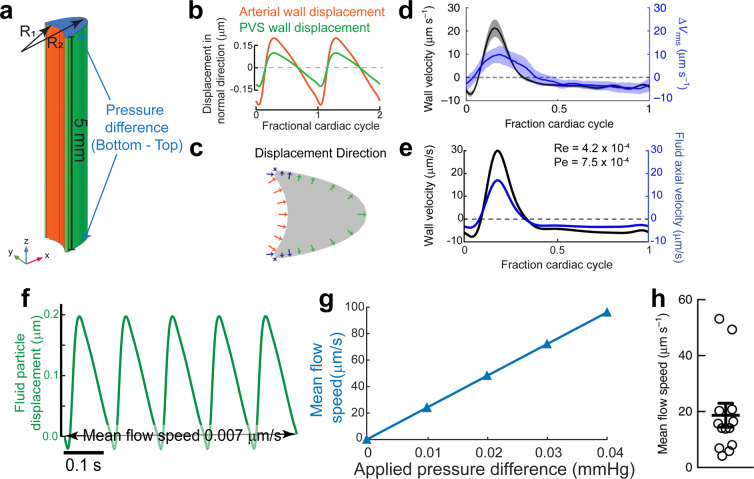
A small, constant pressure gradient can explain directed fluid movement in vivo. (a) Schematic of the model. The length of the PVS is set to 5 mm to match the length of the MCA in mice (4–6mm6,32,33). An additional pressure difference between the inlet and outlet is applied. (b) The displacement of the arterial wall (orange) and the PVS wall (green) used in the simulation. The displacement is given in the direction of the surface normals shown in (c). (c) Positive displacement direction at a cross-section of the PVS, this is the direction of displacement for the plots shown in (b) The Inner wall is shown in orange and the outer wall is shown in green. The displacement changes in amplitude and direction from the inner wall to the outer wall. This transition is carried out using the smooth, step function in COMSOL Multiphysics. The changing direction and length of the blue arrows indicates the smooth transition. (d) Plot showing arterial wall velocity and oscillations in fluid velocity measured in vivo. Adapted from Mestre et al.7 (e) Plot showing arterial wall velocity and oscillations in downstream fluid velocity our simulation matches with those in (d). (f) Plot of the trajectory of a fluid particle in the z direction shows that there is very little pumping by arterial wall movement. (g) Plot showing the relation between an applied pressure difference across the ends of the PVS and the mean anterograde flow speed. An additional 0.01 mmHg pressure difference across the PVS is required to achieve a mean flow speed of 24.4 μm/s, similar to the mean flow speeds observed in vivo (h). (h) Mean flow speed in the PVS measured in vivo. Adapted from Mestre et al.7 (a–c,e). were generated with COMSOL Multiphysics 5.4 (http://comsol.com). (f,g) were generated using MATLAB 2019b (https://www.mathworks.com/products/matlab.html).

