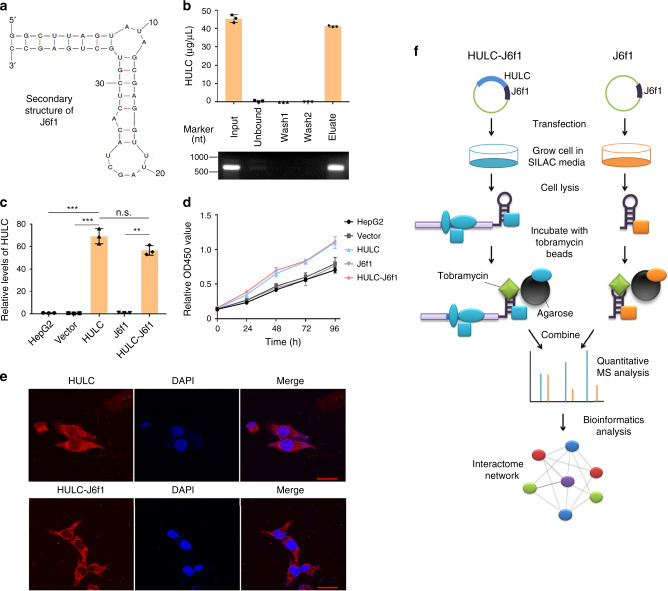
Fig. 1. The mass spectrometric strategy for characterizing HULC interacting proteins.
a The secondary structure of the J6f1 aptamer predicted by MFold (http://unafold.rna.albany.edu/). b In vitro binding of HULC-J6f1 to tobramycin-conjugated agarose beads. HULC-J6f1 was synthesized by in vitro transcription. Data represent mean ± s.d. of triplicate independent analyses. c The levels of HULC in HepG2 cells overexpressing HULC or HULC-J6f1 were measured by qRT-PCR. HepG2 cells expressing empty vector or J6f1 vector were used as controls. Data represent mean ± s.d. (n = 3 independent experiments, ***P < 0.001, n.s., not significant, by two-sided Student’s t test). d The proliferation of HepG2 cells expressing HULC or HULC-J6f1 was measured by CCK8 assay at the indicated time points. Data represent mean ± s.d. of triplicate independent experiments. e The cellular localizations of HULC and HULC-J6f1 were analyzed by RNA-FISH. The scale bar was 20 μm. f The workflow of tobramycin affinity purification mass spectrometry (TOBAP-MS). See also Supplementary Fig. 1. Source data are provided as a Source data file.

