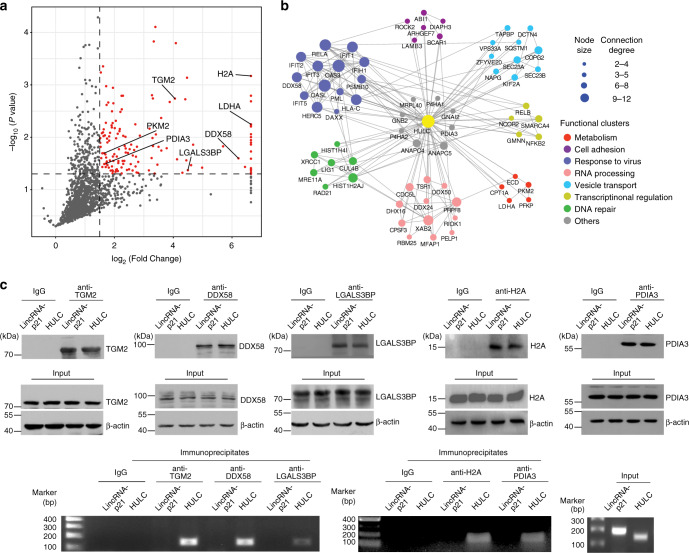
Fig. 2. The identified HULC interacting proteins.
a The volcano plot of the identified proteins. The proteins significantly enriched in the tobramycin purified samples are shown as red dots. Log2 fold change was plotted on the x-axis and −log10 P value was plotted on the y-axis. b The protein interactome network of HULC. PPI information was obtained through a database search using String 9.0 and imported into Cytoscape 3.1.1 for network construction. Proteins and their interactions are shown as nodes and edges. Node size reflects the interaction degree. Proteins are grouped based on their known biological functions. c Validation of selected identified proteins by RIP. Immunoblots of TGM2, DDX58, LGALS3BP, H2A and PDIA3 in the cell lysates and immunoprecipitates are shown in the upper panel. The agarose gel electrophoresis images of HULC amplified by qRT-PCR are shown in the lower panel. LincRNA-p21 was used as an irrelevant lncRNA control. See also Supplementary Figs. 2 and 3. Source data are provided as a Source Data file.

