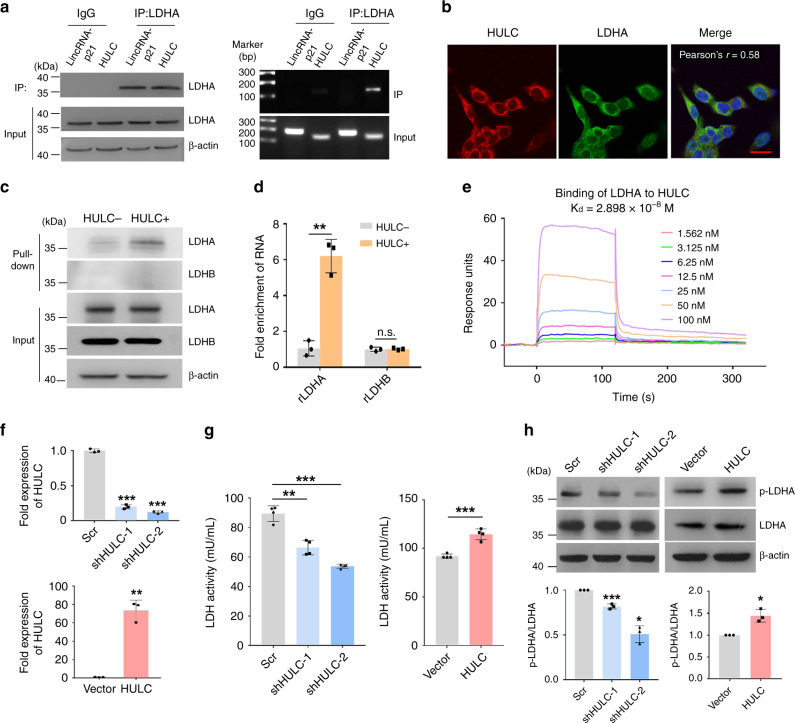
Fig. 3. HULC interacts with the glycolytic enzyme LDHA.
a Validation of the interaction between LDHA and HULC. Immunoblots of LDHA in the cell lysates and immunoprecipitates of LDHA are shown in the left panel. Agarose gel electrophoresis images of HULC amplified by qRT-PCR are shown in the right panel. LincRNA-p21 was examined as the RNA control. b The cellular localizations of HULC and LDHA were analyzed by combining RNA-FISH and immunofluorescence. Cell nuclei were stained with DAPI, and the scale bar was 20 μm. c Biotinylated HULC was incubated with HepG2 cell lysate and then isolated by streptavidin-conjugated beads. LDHA and LDHB in the cell lysate and RNA pull-down were examined by western blotting. Biotinylated antisense HULC was used as the control. d His-tagged rLDHA or rLDHB was incubated with Dynabeads® His-tag isolation magnetic beads, respectively. Next, in vitro transcribed HULC or antisense HULC was incubated with the beads. Then, the RNA-protein complexes were isolated, and the levels of HULC were examined using qRT-PCR. Data represent the mean ± s.d. of triplicate independent experiments (***P < 0.001, n.s., not significant, by two-sided Student’s t test). e The molecular interaction between LDHA and HULC was analyzed to measure the dissociation factor Kd. f The levels of HULC in HepG2 cells with HULC knockdown (upper panel) or overexpression (lower panel) were measured by qRT-PCR. Data represent the mean ± s.d. of triplicate independent experiments (***P < 0.001, by two-sided Student’s t test) g The LDH activities of HepG2 cells with HULC knockdown (left panel) or overexpression (right panel) were examined by a lactate dehydrogenase activity assay kit and compared with the same number of corresponding control cells. Data represent the mean ± s.d. (n = 4 independent experiments, ***P < 0.001, by two-sided Student’s t test). h HULC was silenced or overexpressed in HepG2 cells. The levels of p-LDHA (Y10) and LDHA in the cell lysates were detected by western blotting. Band intensities were measured by ImageJ. Data represent the mean ± s.d. of triplicate independent experiments (*P < 0.05, ***P < 0.001, by two-sided Student’s t test). See also Supplementary Fig. 4. Source data are provided as a Source data file.

