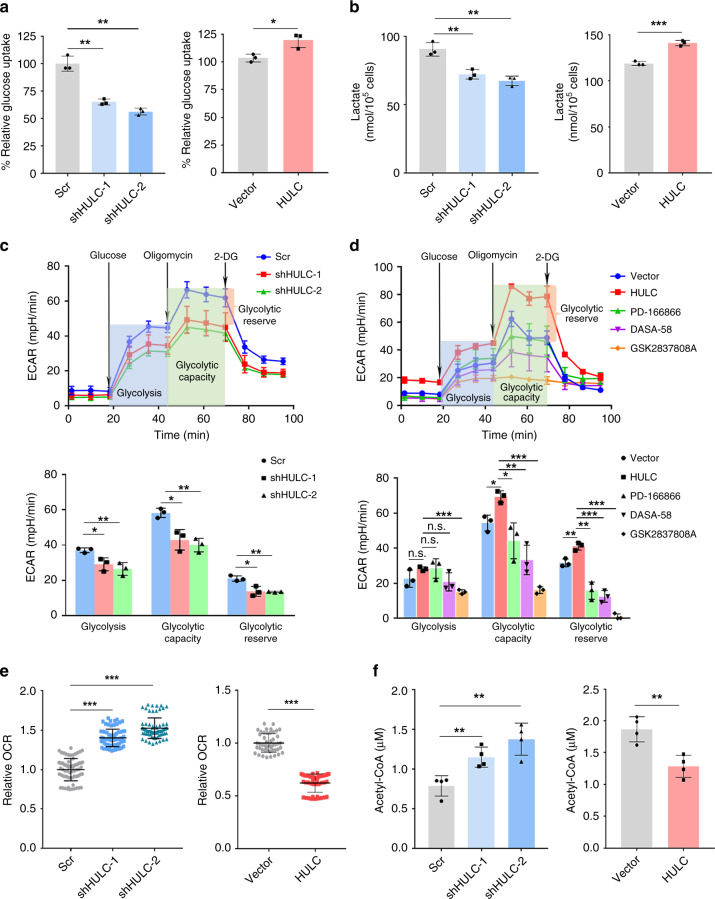
Fig. 6. HULC promotes glycolysis.
a The relative glucose uptake measured in HepG2 cells with HULC knockdown (left panel) or overexpression (right panel). b Lactate production in HepG2 cells with HULC knockdown (left panel) or overexpression (right panel). Levels of lactate in the culture medium were measured and normalized to the cell number. In a and b, statistical analysis was performed by the two-sided Student’s t test. Bars, mean; error bars, s.d. (n = 3 independent experiments, *P < 0.05, **P < 0.01, ***P < 0.001). c Glycolysis flux was examined by measuring the extracellular acidification rate (ECAR) using the Seahorse analyzer. Glucose (10 mM), ATP synthase inhibitor oligomycin (1 μM), and glycolysis inhibitor 2-DG (50 mM) were added to the cells at the indicated time points. The values of glycolysis, glycolytic capacity and glycolytic reserve were calculated by the Seahorse XF24 software. d The glycolysis analysis of HepG2 cells overexpressing HULC treated by FGFR1 inhibitor PD166866 (2.5 μM), PKM2 activator DASA-58(30 μM), or LDHA inhibitor GSK2837808A(10 μM). DMSO was added instead in the control groups. In c and d, statistical analysis was performed by the two-sided Student’s t test. Bars, mean; error bars, s.d. (n = 3 independent experiments, *P < 0.05, **P < 0.01, ***P < 0.001; n.s., not significant). e The relative oxygen consumption rates (OCR) in HepG2 cells with HULC knockdown (left panel) or overexpression (right panel). The OCR values were measured using the Seahorse analyzer. Statistical analysis was performed by the two-sided Student’s t test. Data represent one of triplicate independent experiments. Bars, mean; error bars, s.d. (**P < 0.01, ***P < 0.001). f The relative levels of acetyl-CoA in HepG2 cells with HULC knockdown (left panel) or overexpression (right panel) as compared with the same number of corresponding control cells. Bars, mean; error bars, s.d. (n = 4 independent experiments, **P < 0.01, by the two-sided Student’s t test). See also Supplementary Fig. 6. Source data are provided as a Source Data file.

