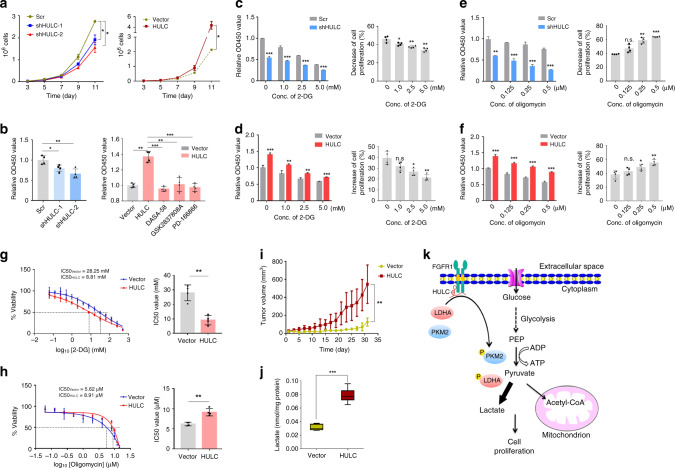
Fig. 7. HULC promotes cell proliferation by elevating aerobic glycolysis.
a The growth curve of HepG2 cells with HULC knockdown (left panel) or overexpression (right panel). Statistical analysis was performed by one-way analysis of variance (ANOVA) (*P < 0.05). b Proliferation of HepG2 cells with HULC knockdown (left panel) or overexpression (right panel) was measured with a CCK8 assay. For rescue experiments, HepG2-HULC cells were treated by FGFR1 inhibitor PD 166866 (2.5 μM), PKM2 activator DASA-58 (30 μM), or LDHA inhibitor GSK2837808A (10 μM), respectively. DMSO was added instead in the control groups. HepG2 cells with HULC knockdown (c) or overexpression (d) were incubated with indicated concentrations of 2-DG, and cell proliferation was measured with the CCK8 assay. HepG2 cells with HULC knockdown (e) or overexpression (f) were incubated with indicated concentrations of oligomycin, and cell proliferation was measured with the CCK8 assay. IC50 values of 2-DG (g) and oligomycin (h) in HepG2-HULC cells were calculated by dose curve analysis. In b–h, statistical analysis was performed by two-sided Student’s t test. Bars, mean; error bars, s.d. (n = 4 independent experiments, *P < 0.05, **P < 0.01, ***P < 0.001, n.s., not significant). i HepG2 cells expressing empty vector or HULC were injected subcutaneously into nude mice, and tumor volumes were measured every 2 days (n = 4 for each group). Bars, mean; error bars, s.d. (***P < 0.001, by one-way ANOVA). j The levels of lactate in the tumors were measured and normalized using protein concentrations (n = 13 tissues). The box plot includes data between the 25th and 75th percentiles, with the horizontal line representing the median. The upper whisker is the maxima, and the lower whisker is the minima. Bars, mean; error bars, s.d. (***P < 0.001, by two-sided Student’s t test). k The proposed molecular mechanism by which HULC regulates cell proliferation through modulating glycolysis. See also Supplementary Fig. 7. Source data are provided as a Source data file.

