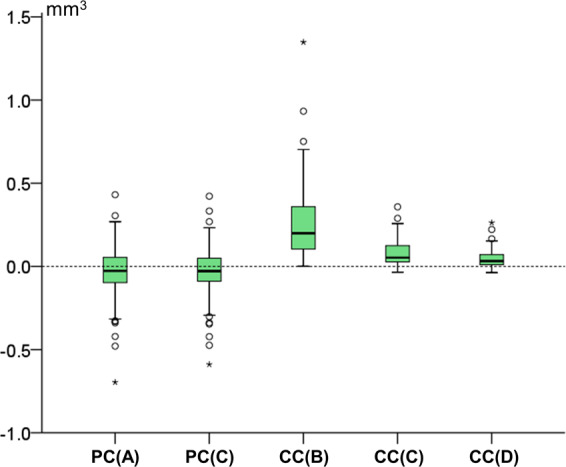
Figure 5.

Box plots showing in the y-axis the difference of each technique with the gold standard technique in tooth wear measurements. The upper limit of the black line represents the maximum value, the lower limit the minimum value, the box the interquartile range, and the horizontal black line the median value (trueness). Zero value indicates perfect agreement with the gold standard. The vertical length of each plot indicates precision.
