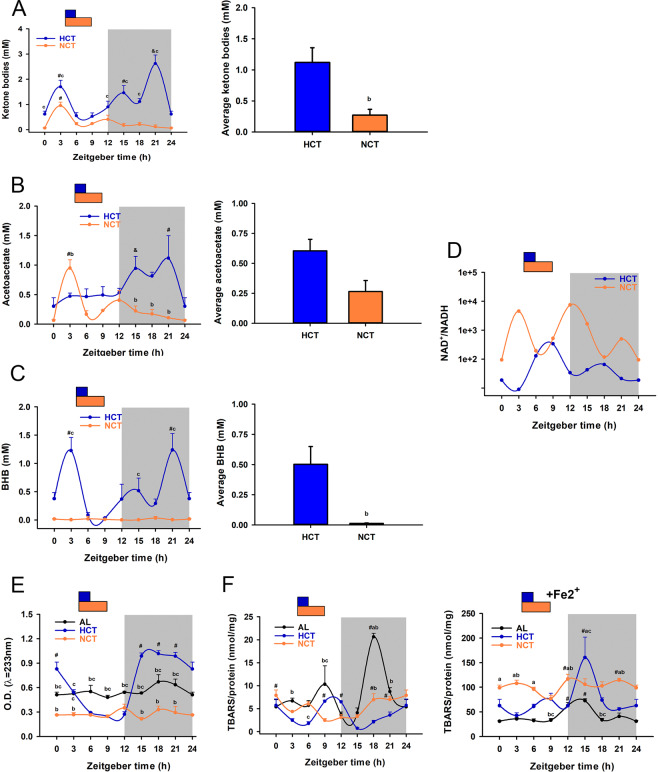
Figure 6.
Effects of HCT and NCT on liver ketone bodies and redox status at day 21 of each protocol (n = 4 rats). Daily profile and daily average of (A) total serum ketone bodies, (B) acetoacetate and (C) β-hydroxybutyrate (BHB). (A-C left) Daily profile (A–C right) and daily average of serum ketone bodies. Each point represents the mean ± SEM. For total ketone bodies: P < 0.01 c vs NCT, # vs ZT0, 6, 15, 18, 21 in HCT, $ vs ZT0, 6, 9 in HCT; P < 0.05 & vs ZT0, 3, 6, 9, 12, 15, 18 in NCT; for acetoacetate: P < 0.01 b vs HCT, # vs ZT0, 6, 9, 15, 18, 21 in NCT; P < 0.05 # vs ZT0, 3, 6, 9 HCT, & vs ZT0 in HCT; for β-hydroxybutyrate: P < 0.01 c vs NCT, # vs ZT0, 6, 9, 12, 15, 18 in HCT. Bars represent the mean ± SEM. P < 0.05 b vs HCT. (D) Total redox state in terms of the NAD+/NADH ratio. Daily profile of lipoperoxidation in terms of (E) conjugated dienes, (F-left) TBARs and (F-right) TBARs + Fe2+. For conjugated dienes: P < 0.001 b vs HCT, c vs NCT; # vs ZT3, 6, 9, 12 in HCT. For TBARs: P < 0.05 a vs AL, b vs HCT, c vs NCT; # vs ZT9, 12, 15 in NCT, vs ZT15 in HCT, vs ZT12 in AL; for TBARs + Fe2+: P < 0.05 a vs AL, b vs HCT, c vs NCT; # vs ZT9 in NCT; vs ZT3 in HCT; vs ZT0, 3, 6, 9, 18, 21 in AL.

