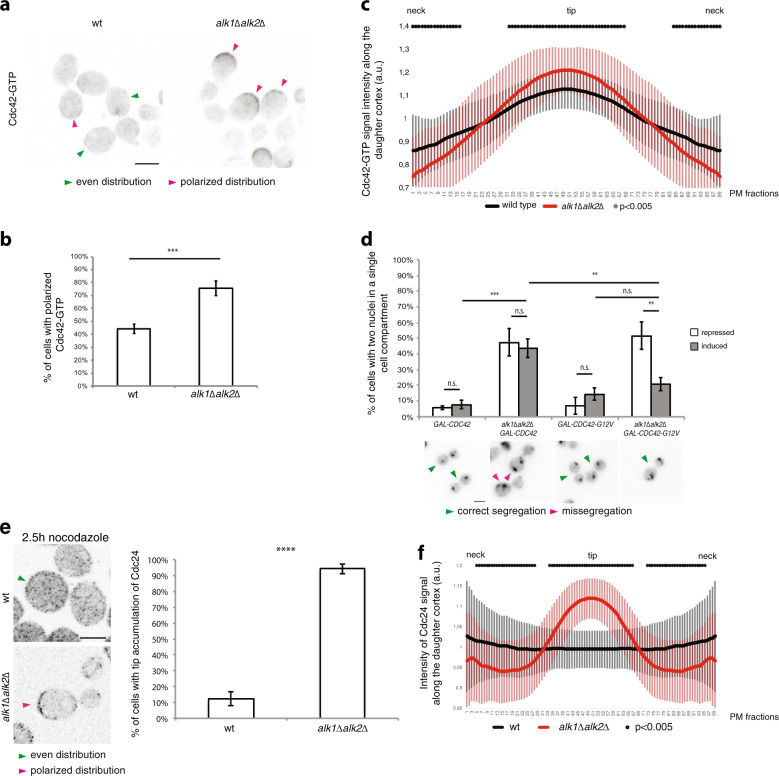
Fig. 1. Haspin modulates the distribution of Cdc42-GTP and Cdc24.
a–c Localization of active Cdc42 was assessed through a CRIB-TdTomato probe, specific for Cdc42-GTP. G1-arrested wt or haspin-lacking cells were released in nocodazole-containing medium for 2.5 h and analyzed by fluorescence microscopy a, scoring the percentage of cells with polarized Cdc42-GTP b. Green and magenta arrows in panel a show cells with isotropic distribution of GTP-Cdc42 and sites of polarized Cdc42 activity, respectively; scale bar: 5 μm. c Average CRIB-tomato signal intensity along the daughter cell PM (see section “Materials and methods” for full description). d wt or hyperactive Cdc42, under the control of the GAL1 promoter, was expressed for 45 min in mitotically arrested control or alk1Δalk2Δ cells. The effect of Cdc42 overexpression on nuclear segregation localization was assessed by fluorescence microscopy after an M-phase delay. Green and magenta arrows point at: correct or defective segregation. e, f After pre-synchronization in G1, wild-type or haspin-lacking cells were released into nocodazole-containing medium. The localization of Cdc24-GFP was evaluated by fluorescence microscopy. Cells that accumulate the GEF at the bud tip were scored at given time points (green and magenta arrows indicate examples of cells with diffuse PM localized Cdc24 and daughters with polarized Cdc24, respectively); graphs report the percentage of cells with Cdc24 at the bud tip scored 2.5 h after G1 release in nocodazole-containing medium; error bars represent standard deviation. Cdc24-GFP signal intensity along the PM quantified on 60 nocodazole-arrested cells from three independent experiments is reported in f. 3 d or 4 b independent experiments were performed, counting 100 cells for each repeat; error bars represent standard deviation. Scalebars correspond to 5 μm. t-test was applied as a statistical measurement in b, d, e; n.s.: not significant; *P < 0.05; **P < 0.01; ***P < 0.005; ****P < 0.001. Black dots in c–f represent fractions for which the intensity between the strains is significantly different (P < 0.005, calculated with Bonferroni correction); error bars represent standard deviation.

