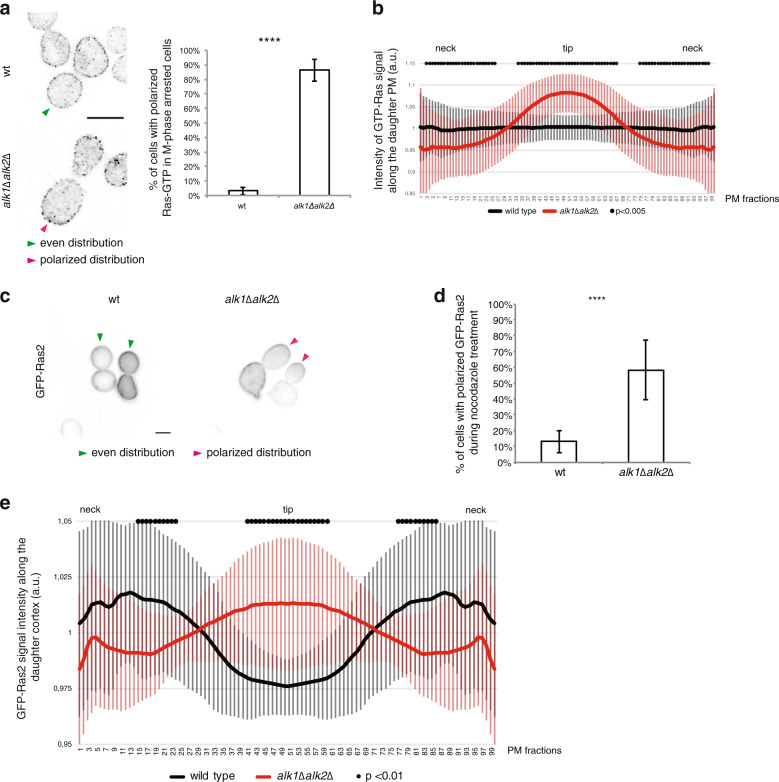
Fig. 4. Haspin regulates Ras distribution.
The localization of Ras-GTP in wild-type or haspin-lacking cells was evaluated by fluorescence microscopy exploiting an eGFP-RBD3 probe a and b. Graph in a reports the percentage of cells with polarized active-Ras during nocodazole treatment; plot in b shows the average intensity of Ras-GTP in mitotic cells. c–e Cells were arrested in G1 and then released for 2.5 h in nocodazole. Galactose was added at the beginning of nocodazole treatment to induce expression of GFP-RAS2. At the end of the treatment cells were fixed and the percentage of cells with polarized Ras2 were scored by fluorescence microscopy. Panel c shows a representative image; graph d shows the percentage of polarized cells; plot in e reports the average intensity of Ras2-GFP in mitotically arrested cells. Green and magenta arrows in a and c show cells with diffuse PM or polarized given proteins, respectively. Plots in b and e show the fluorescence intensity signal of given constructs along the PM from 60 cells from three independent experiments (black dots represent fractions for which the intensity between the strains is significantly different (P < 0.01, calculated using Bonferroni correction); error bars represent standard deviation). t-test was applied as a statistical measurement in (a, b, d, e); n.s.: not significant; *P < 0.05; **P < 0.01; ***P < 0.005; ****P < 0.001.

