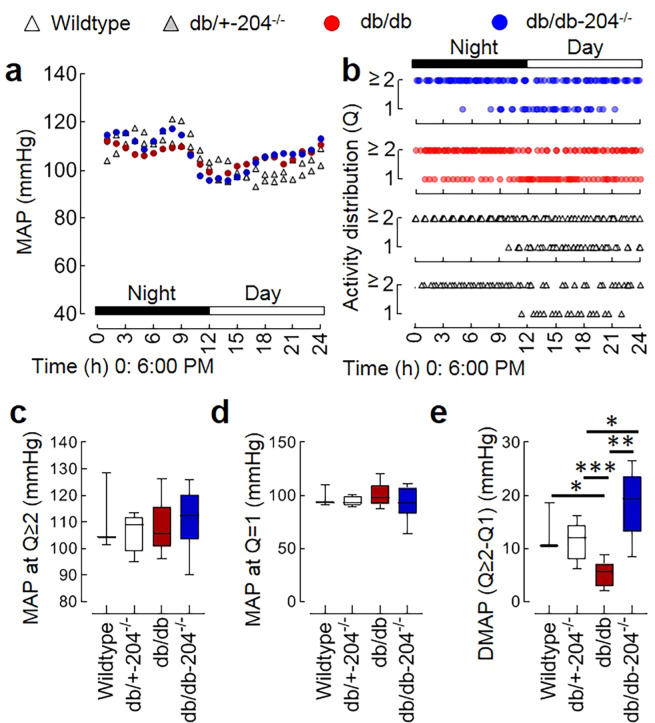
Figure 5.
db/db mice lacking miR-204 have better blood pressure decline during inactivity. (a) The representative curve of 24 hr (day and night) telemetric recording of the average mean arterial pressure (MAP) in the wildtype, db/+−204−/−, db/db, and db/db-204−/− mice. Wildtype: n = 3, db/+−204−/−: n = 7, db/db: n = 7, and db/db-204−/−: n = 6. (b) The mouse locomotor activity distribution in quartiles. The ‘y’ axis shows an hourly mean activity quartile. 1; 0–25%, ≥2; 25–100%. The ‘x’ axis shows time (24 h) beginning at 6:00 PM. (c–e) The MAP during activity quartile ≥2 (c), activity quartile 1 (d) and a difference in the MAP during activity quartile ≥2 and activity quartile 1 (e). Wildtype: n = 3, db/+−204−/−: n = 7, db/db: n = 7, db/db-204−/−: n = 6. *p < 0.05; **p < 0.01; ***p < 0.001 vs. indicated group. In box-and-whisker plots, whiskers show minima and maxima and the central line indicates median. The significance of the difference between groups was performed by one-way analysis of variance (ANOVA) followed by Tukey’s test.

