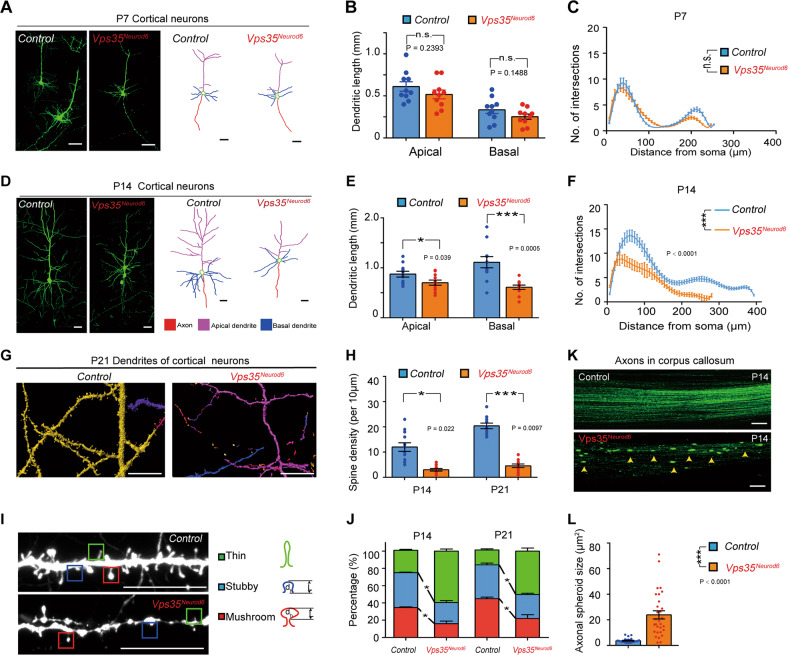
Fig. 2. Dendritic maturation defect and axonal spheroid formation in Vps35Neurod6 neocortex.
a, d Representative images of EYFP+ cortical neurons (left) and reconstructed neurons (right) at P7 and P14. b, e Quantification analysis of the apical and basal dendritic length. (n = 12 neurons from four animals per genotype; unpaired two-tailed t-test). c, f Sholl analysis for dendritic complexity. (two-way ANOVA with a Tukey’s multiple comparisons test). g Representative 3D-reconstructed dendritic spines from P21 brain sections. h Quantifications of spine density at ages of P14 and P21. (n = 12 from four mice per group, unpaired two-tailed t-test). i Representative Z-stack projection images of dendritic spines. Spines are categorized as mushroom (red), stubby (blue), and thin (green) subtypes. j Quantification analysis of data in h for percentage of different types of spines of neurons at ages of P14 and P21. (Four neurons from four mice per group, two-way ANOVA with Tukey’s multiple comparison test). k Confocal images of GFP+ projecting axons in CC after IUE of CAG-GFP at E14.5 control (Vps35f/f) and Vps35Neurod6 embryos. l Quantification analysis of data in k. (n = 30 from three mice per group, unpaired two-tailed t-test). Individual data points were shown as dots with group mean ± s.e.m. *P < 0.05; ***P < 0.001; n.s. not significant.

