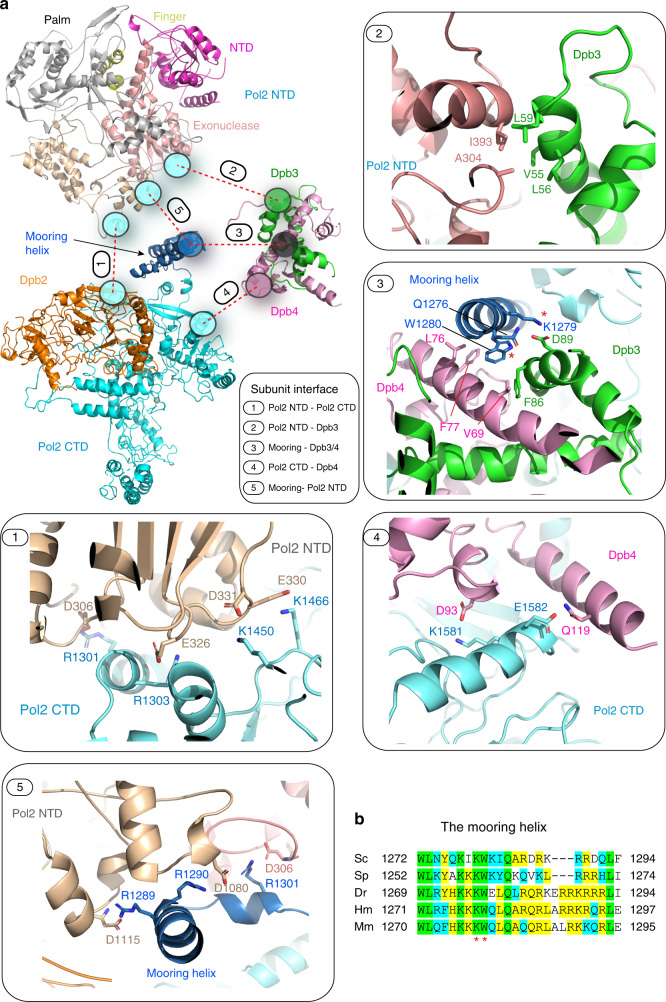
Fig. 3. Domain–domain interactions within Pol ε.
a Pull-apart of the structure. Each circle represents the contact region between two domains. The oval with a number indicates the interaction that is enlarged and shown in the numbered enlarged boxes. 1: between Pol2 NTD and CTD; 2: between Pol2 NTD and Dpb3; 3: between mooring helix and Dpb3–4; 4: between Dpb3 and Dpb4; and 5: between mooring helix and Pol2 NTD. b Sequence alignment of the mooring helix in Sc (S. cerevisiae), Sp (S. pombe), Dr (D. reos), Hs (H. sapien), Mm (M. muscarus). The red asterisks indicate conserved residues involved in interactions with Dpb3–4.

