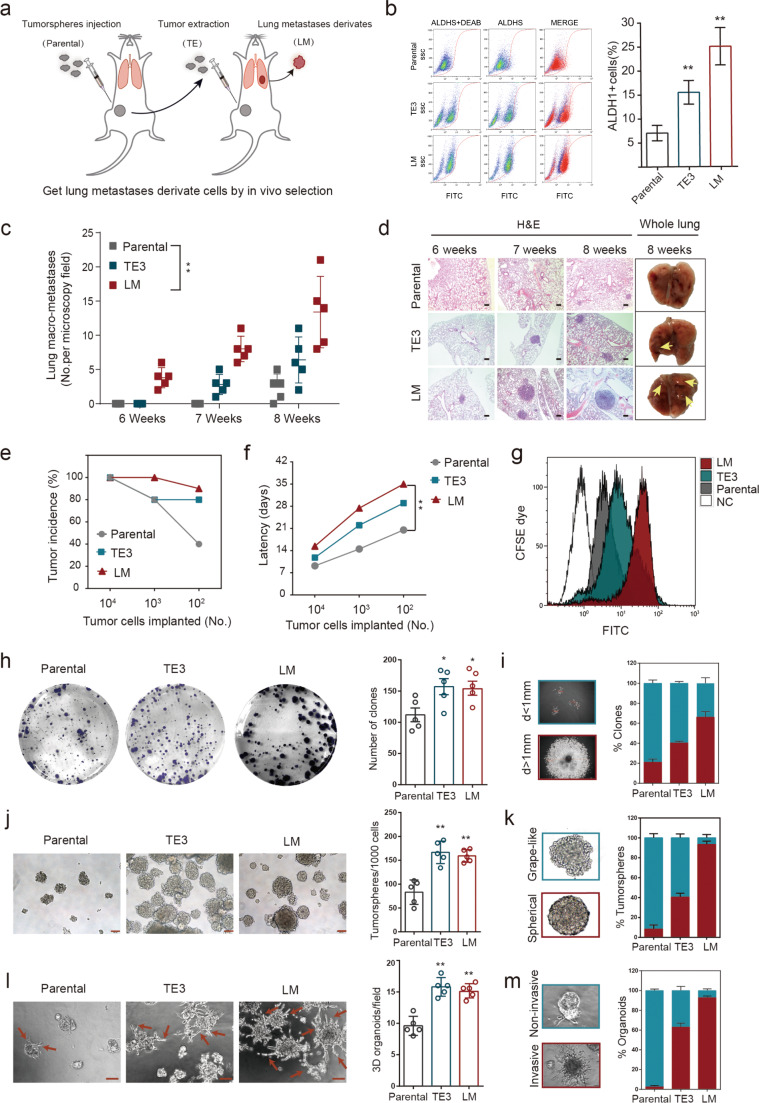
Fig. 1. Establishment of an MIC model.
a Schematic of the in vivo selection strategy used to establish the MIC model. Breast cancer cells cultured with sphere culture medium were injected at low cell numbers into the mammary fat pads of NOD-SCID mice, and the resulting tumors were dissociated into single-cell suspensions, cultured in vitro, and re-injected over multiple rounds. TE: tumor extraction; LM: lung metastases. b Left: representative ALDEFLUOR analyses of parental, TE3, and LM cells. DEAB, a specific inhibitor of ALDH1, was used as a control. Right: quantification of the ALDEFLUOR assays (n = 3). Data are presented as the mean ± SD. c Parental, TE3, or LM cells were injected intravenously (i.v., tail vein) (5 × 10⁵ cells per mouse), and macro-metastases (macro-mets) >100 µm were quantified from microscopy tissue sections from four lung lobes per animal to calculate the metastasis count at the indicated time point. Data are presented as the mean ± SD. d H&E images of lungs from mice shown in (c). Scale bars, 200 µm. e, f Cells were admixed with Matrigel and inoculated into the mammary fat pad of NOD-SCID mice at the indicated numbers (1 × 10⁴ cells, n = 5 per group; 1 × 10³ cells, n = 10 per group; 1 × 10² cells, n = 10 per group). Incidence of tumor formation (e) and tumor latency at the indicated cell number (f). g Flow cytometry analysis of CFSE dye retention by parental, TE3, and LM cells after 3 days. NC: negative control. h, i Colony-formation assays of parental, TE3, and LM cells. h Cells were cultured for 14 days followed by staining (left) and quantification (right, n = 5). Representative photographs are shown. i Representative images (left) and quantification (right) of small clones (d < 1 mm) (teal) and large and compacted clones (d > 1 mm) (red). Data are presented as the mean ± SEM. j, k Sphere formation assays of parental, TE3, and LM cells. j Representative bright-field images (left) and quantification (right, n = 5) of tumorsphere formation after 6 days of culture. Scale bars, 100 µm. k Representative images (left) and quantification (right) of grape-like (teal), and spherical (red) tumorspheres. Data are presented as the mean ± SEM. l, m 3D Matrigel on-top assays of parental, TE3, and LM cells. l Representative phase-contrast images (left) and quantification (right, n = 5) of 3D organoid formation after 10 days of culture. Arrows indicate filopodium-like protrusions. Scale bars, 100 µm. m Representative images (left) and quantification (right) of invasive organoid (red) and mass organoid (teal). Data are presented as the mean ± SEM.

