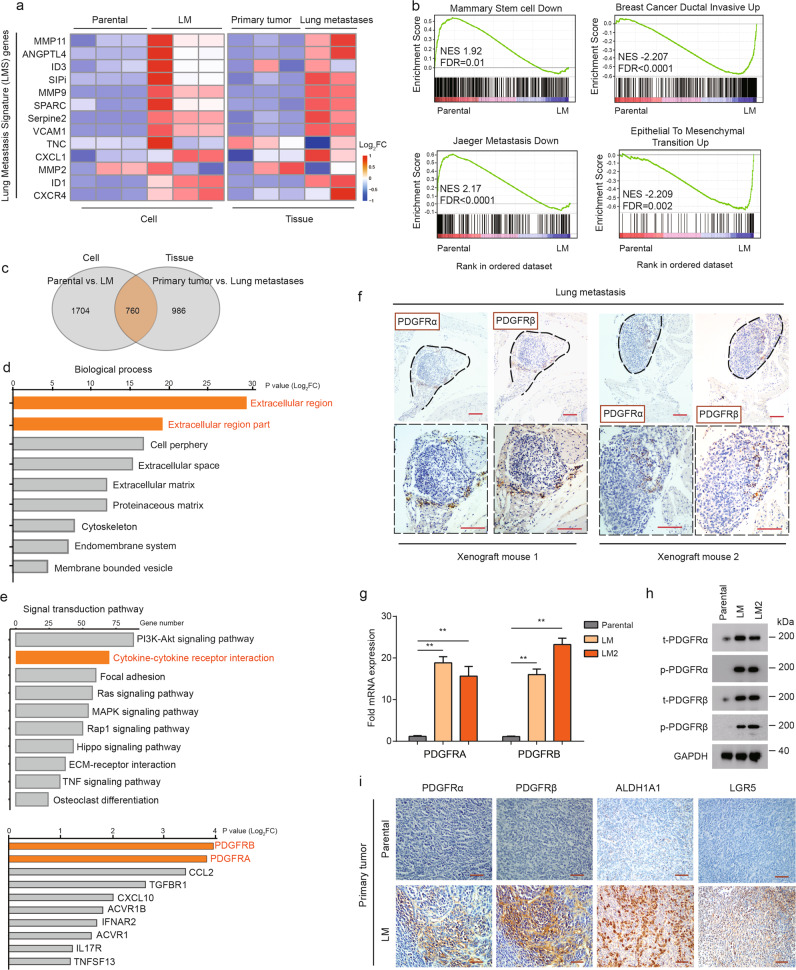
Fig. 2. PDGFRα and PDGFRβ are overexpressed in LM populations.
a Heatmap representation of the expression of lung metastasis signature (LMS) genes in indicated cell populations and tumor tissues. Data are presented as rows normalized. b KEGG enrichment maps of upregulated MIC-associated gene sets of LM cells versus paternal cells. NES normalized enrichment score, FDR false discovery rate. c Venn diagram showing the overlap of the differentially expressed genes of the parental and LM populations between in vitro and in vivo analyses. Signatures are generated by including genes with fold changes higher or lower than +1 and −1, respectively. d Top represents biological process categories upregulated in LM cells and tissues. e Overrepresented signal transduction pathways and top overrepresented genes in the cytokine–cytokine receptor interaction in LM populations. f Representative IHC images of PDGFRα and PDGFRβ staining in serially sectioned mouse lung metastases formed from LM cells. Images below (black boxes) represent 2× enlargement of the image above. Scale bars, 100 µm. g PDGFRA/B mRNA levels in parental, LM, and LM2 cells. The levels were normalized to those of GAPDH. Data are presented as the mean ± SD. h Western blot analysis of PDGFRα and PDGFRβ expression in parental, LM, and LM2 cells. i Representative IHC images of PDGFRα, PDGFRβ, ALDH1A1, and LGR5 staining in serially sectioned mouse primary tumor formed from LM cells. Scale bars, 100 µm.

