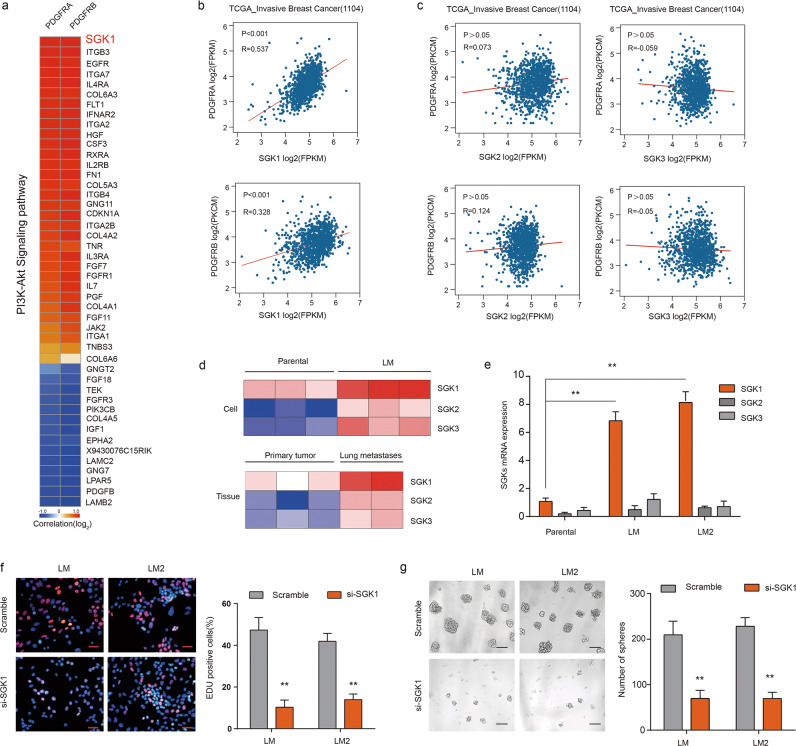
Fig. 5. SGK1 and PDGFRA/PDGFRB are co-expressed in MICs.
a Heatmap of genes of PI3K–AKT pathway that correlated with the expression of PDGFRA and PDGFRB based on RNA-seq data of LM cells. b The gene expression levels of SGK1 and PDGFRA/B were measured in the TCGA_invasive breast cancer cohort (1104) data sets. Correlation values and P-values were determined as indicated. c The gene expression levels of SGK2/3 and PDGFRA/B were measured in the TCGA_invasive breast cancer cohort (1104) data sets. Gene expression is reported as log2 values. d Heatmap representation of the expression of SGK1, SGK2, and SGK3 in the indicated cell populations and tumor tissues. Data are presented as rows normalized. e RT-PCR analyses of SGK1, SGK2, and SGK3 expression in parental, LM1, and LM2 cell populations. The levels were normalized to those of GAPDH. Data are presented as the mean ± SD. f Representative images (left) and quantification (right) of EdU-positive LM1 and LM2 cells transfected with the indicated siRNAs in the EdU assay. Scale bars, 20 µm. g Representative images (left) and quantification (right) of spheres formed from LM1 and LM2 cells transfected with the indicated siRNAs. Scale bars, 50 µm.

