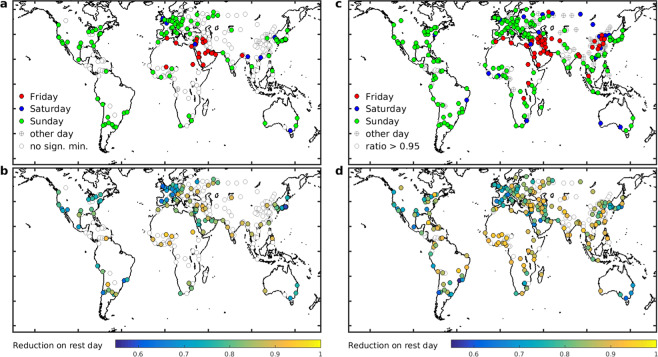
Figure 1.
(a) Location of studied cities. The color indicates the day of minimum according to OMI NO2 data over 2005–2017. Open circles indicate cities for which the OMI minimum is not significant (see text). (b) Normalised NO2 column on the day of the minimum of OMI data. (c,d) Same as a and b for TROPOMI data over May 2018-April 2019. The numerical values of OMI and TROPOMI normalised columns are given in Supplementary Table S1. The map is generated using the shapefile landareas.shp from the mapping toolbox of MATLAB version R2013a (8.1.0.604), Natick, Massachussetts, The MathWorks Inc.

