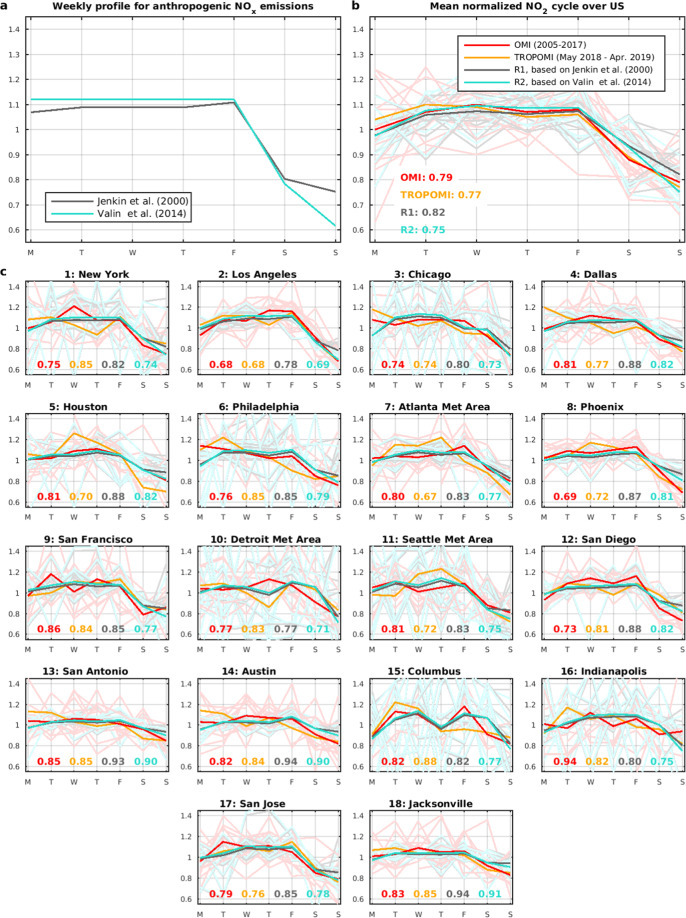
Figure 4.
(a) Normalised weekly profiles of anthropogenic NOx emissions over the U.S. used in simulations R1 and R2. (b) Mean normalised weekly NO2 cycle for all U.S. cities (weighted by population) from OMI (2005–2017, red) and TROPOMI (orange), and from model runs R1 (black) and R2 (light blue). Dark red line: average OMI cycle for 2005–2017; pale lines: individual years. The normalised column on Sunday is given inset. (c) Same as b for individual cities ranked according to the population of their urban areas (en.wikipedia.org/wiki/List_of_United_States_urban_areas).

